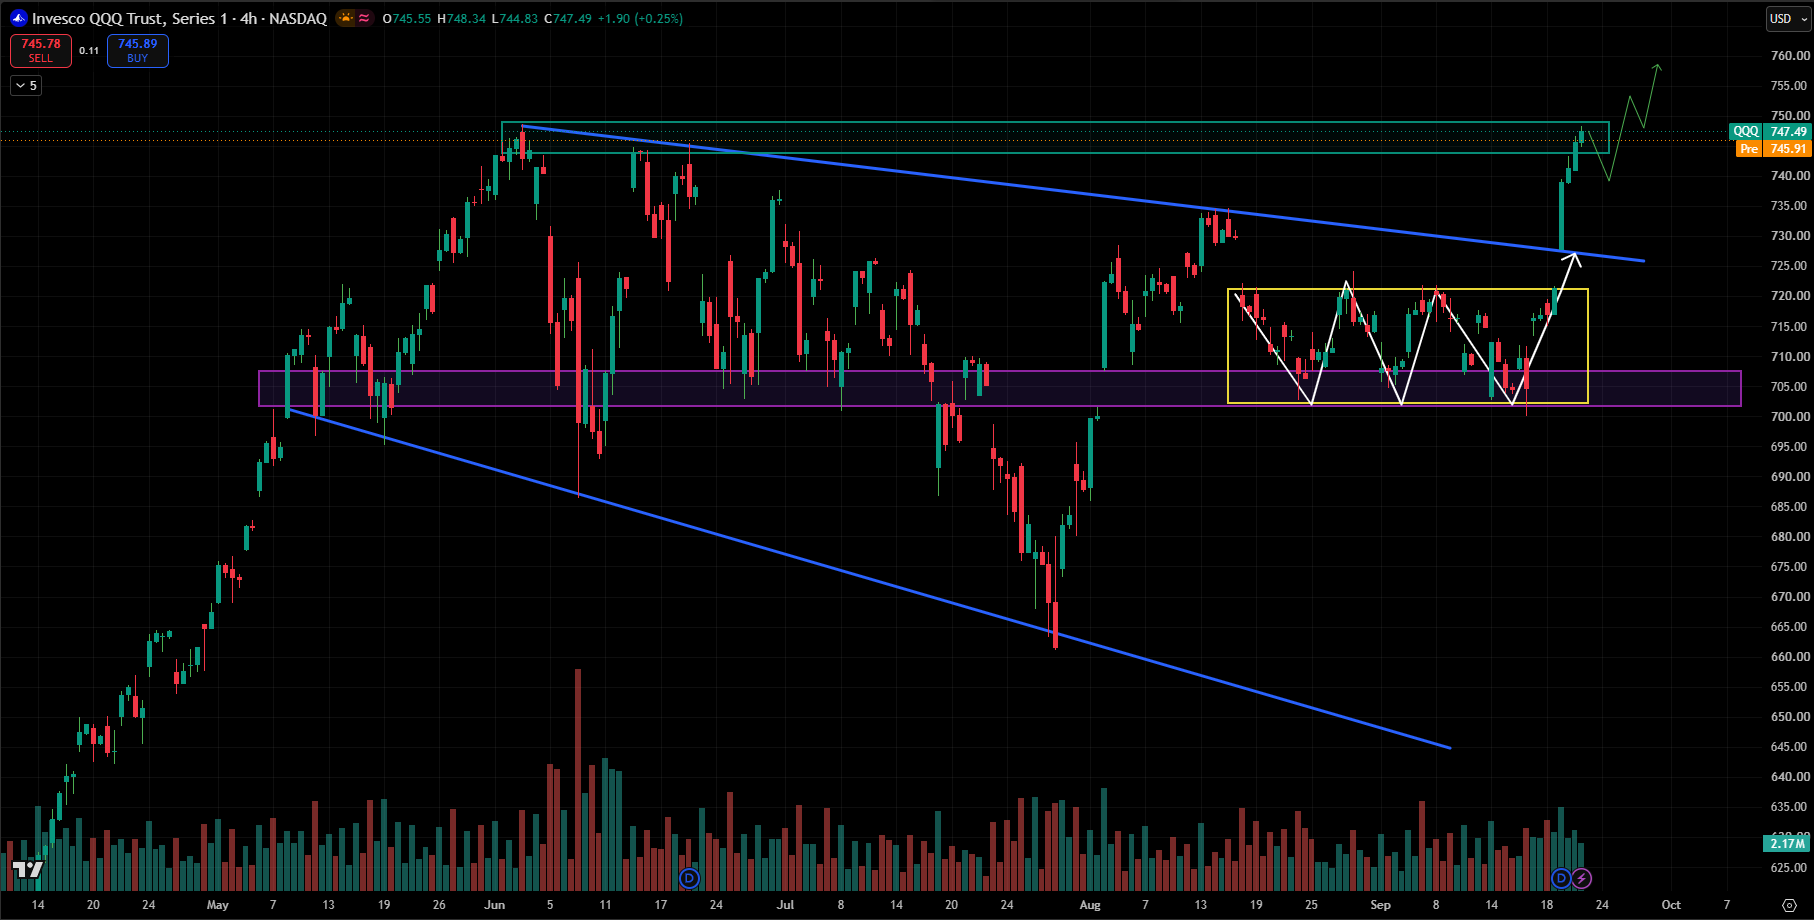
- QQQ has broken above the descending trendline, confirming a bullish structural breakout.
- Price is now testing the key $747–$750 resistance zone near recent highs.
- A sustained breakout above $750 could open the way toward $755–$760.
- The previous $720–$725 resistance zone is now the key support area on any pullback.
- Major downside support remains around $703–$705, with $700 as a critical level.
- The recent range breakout suggests bullish momentum, but a retest of $720–$725 would be healthy.
- Bias remains bullish above $720–$725, while a rejection below this zone could signal a deeper pullback.
J
QQQ Explodes Higher After Breaking Key Trendline. Bulls Take Control: $755–$760 Next?
G
A: Short Swing Trade - NEW POSITION
Stock : A
Side : Short
Entry : 164
Qty : 250
Follow the trades on sheet:https://shorturl.at/kxhUW
Note: All content, trading ideas, signals, setups, open positions, and closed positions in this sheet are for educational and informational purposes only. They should not be construed as financial advice or recommendations to buy or sell any security or specific assets.

G
SWING TRADE - NEW POSITION IN AAPL
SWING TRADE - NEW POSITION
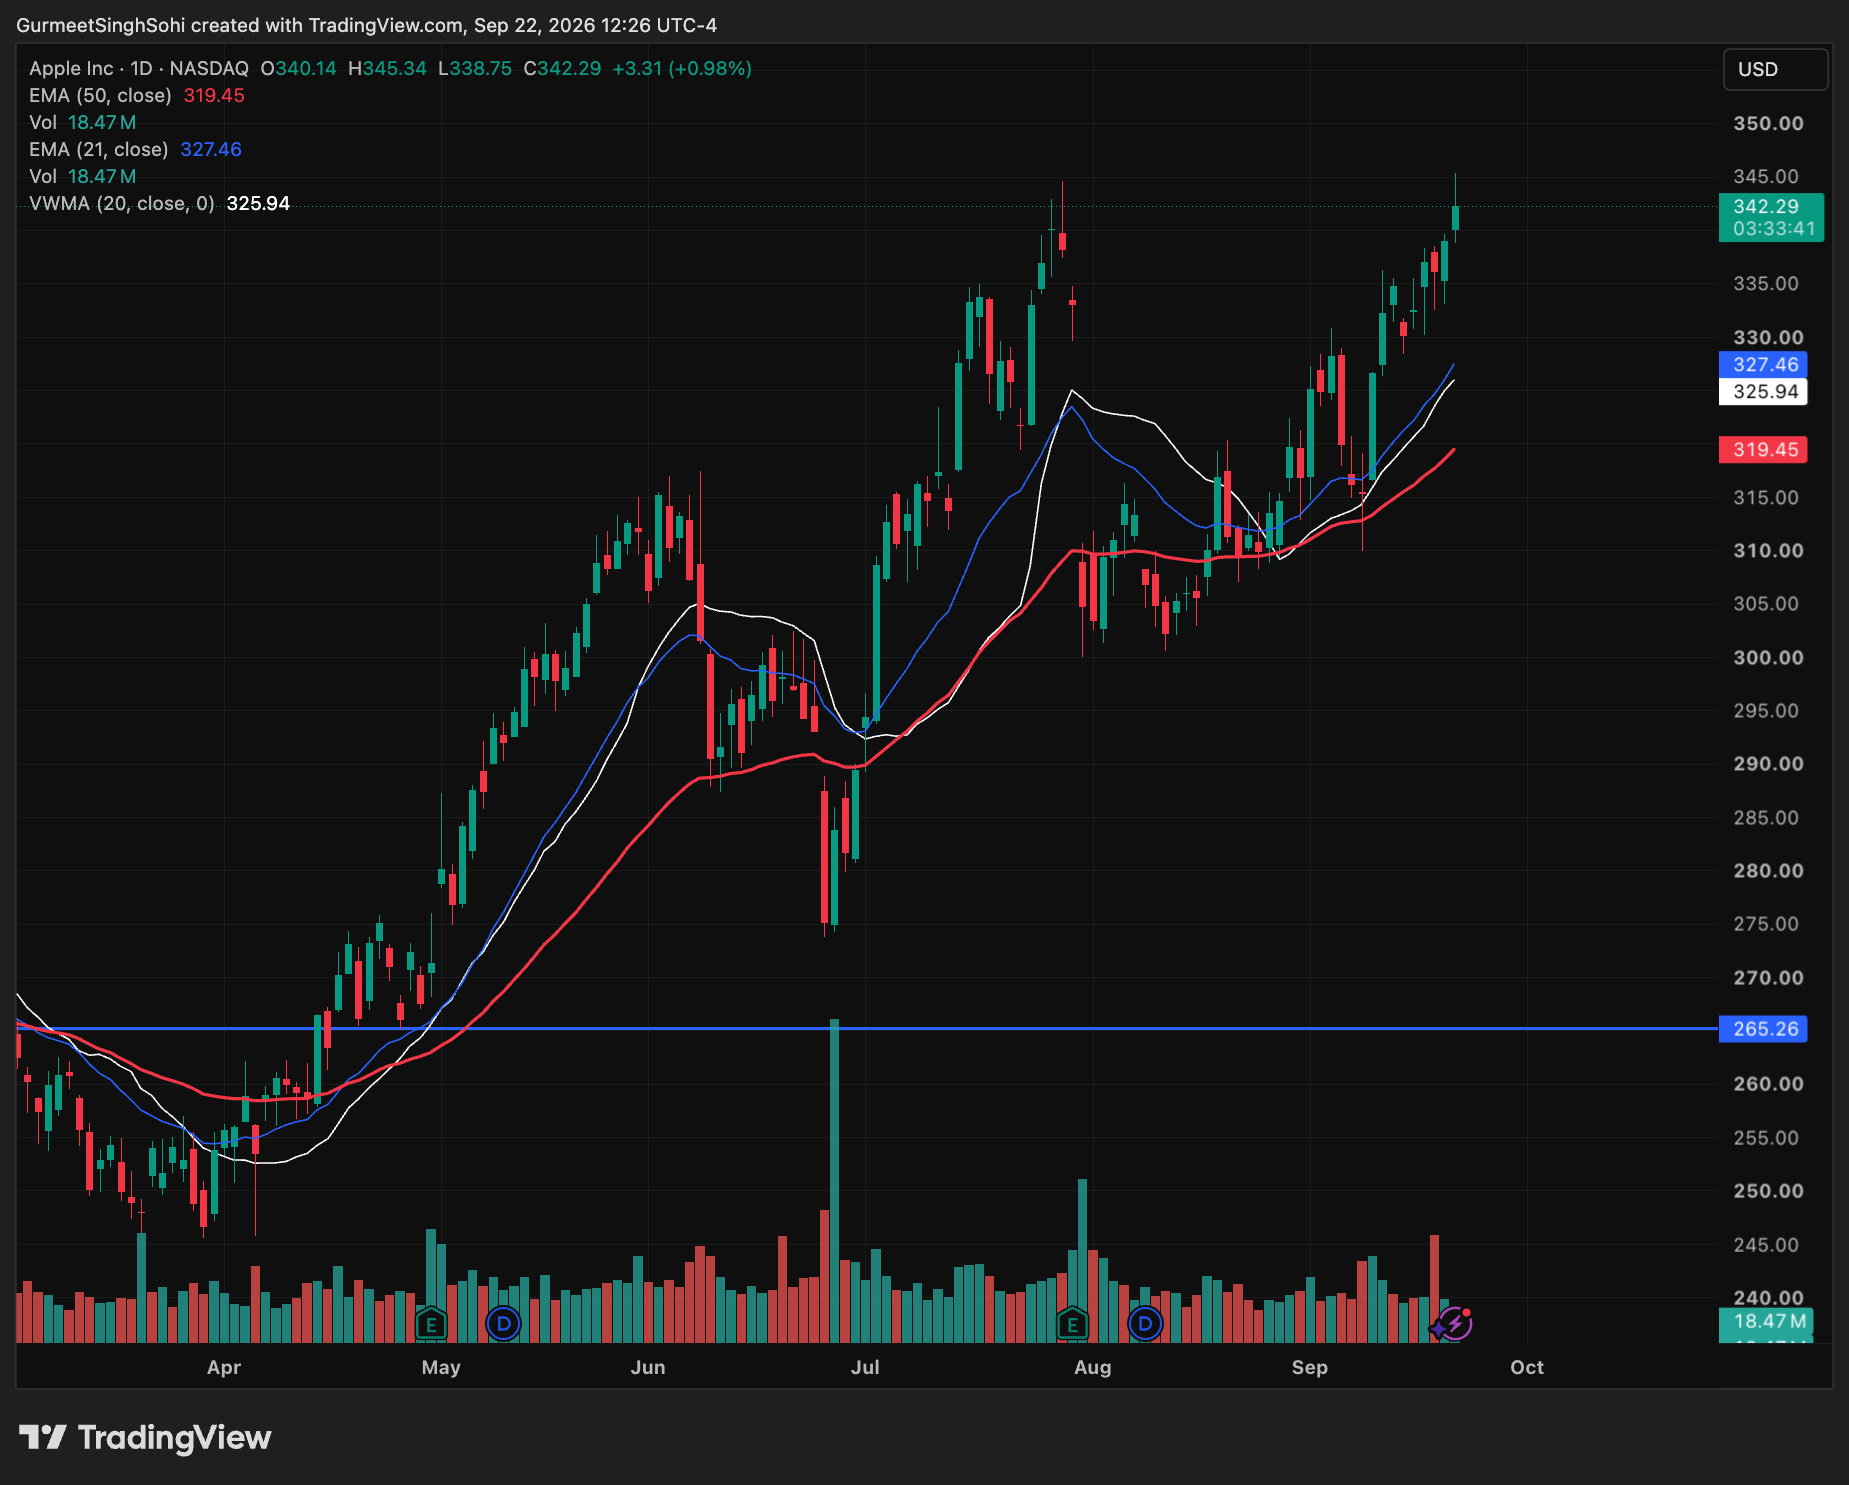
Stock : AAPL
Side : Short
Entry : 341.40
Qty : 100
Follow the trades on sheet: https://shorturl.at/kxhUW
Note: All content, trading ideas, signals, setups, open positions, and closed positions in this sheet are for educational and informational purposes only. They should not be construed as financial advice or recommendations to buy or sell any security or specific assets.
J
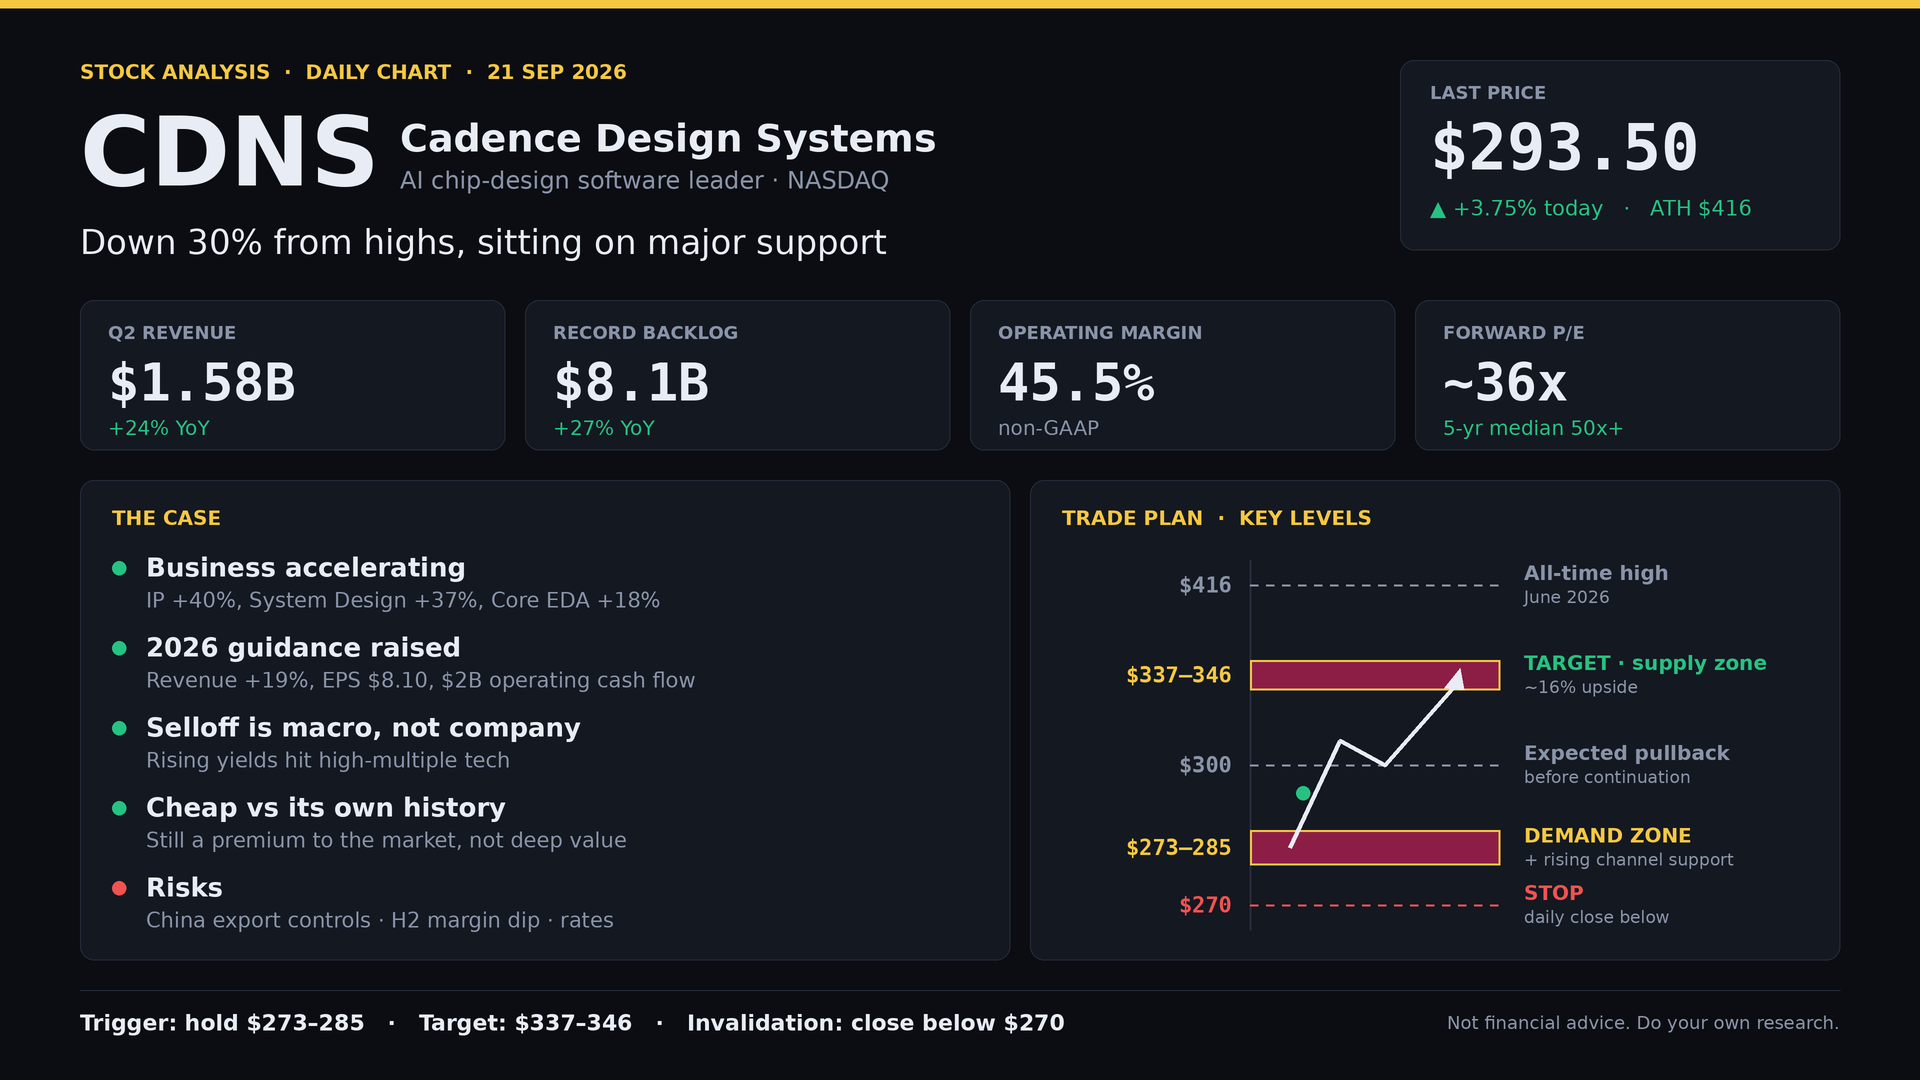
Cadence Design Systems (CDNS) Stock Analysis: AI Chip-Design Leader Down 30% From Highs, Sitting on Major Support.
Overview
- Cadence makes the software engineers use to design every advanced chip; near-duopoly with Synopsys
- Stock fell from an all-time high of $416 (June) to ~$273, now rebounding at ~$293
- No business breakdown behind the drop; driven by rising yields and pressure on high-multiple tech
Business model
- Sells EDA software, design IP, and hardware verification systems on multi-year contracts
- Highly recurring revenue, extreme switching costs, customers include every major chipmaker and hyperscaler
- More chips designed = more Cadence tools consumed, regardless of which chip wins
Fundamentals
- Q2 2026 revenue $1.58B, +24% YoY; non-GAAP EPS $2.11, +28%
- Record backlog $8.1B, up 27%; non-GAAP operating margin 45.5%
- IP revenue +40%, System Design +37%, Core EDA +18%
- Cash $1.44B vs debt $2.5B; $200M buyback in the quarter
Valuation metrics
- ~36x 2026 EPS guide of $8.10, vs five-year median above 50x
- Market cap ~$81B, roughly 13x 2026 sales
- Cheap versus its own history, not cheap versus the market; this is a quality-at-a-discount setup, not deep value
Technical analysis (daily chart)
- Price is holding the $273–$285 demand zone, which has caught every major low since late 2024
- Zone lines up with the rising channel support from the April 2025 low; double confluence
- Strong bounce candle off the zone, +3.7% on the day
- Expected path: push higher, pullback toward $300, then continuation to the $337–$346 supply zone (~16% upside)
- Invalidation: daily close below $270 breaks both the zone and the channel
Future growth outlook
- 2026 guidance raised to $6.26–$6.34B revenue (+19%) and $2B operating cash flow
- Agentic AI design tools increase tool usage per chip; management hasn't baked a monetization step-up into guidance
- Expanding partnerships with Nvidia, TSMC, Samsung, Intel and OpenAI
- Risks: China export controls, H2 margins dipping on acquisition integration, still-premium multiple if yields keep rising
Snapshot
- Business: accelerating, record backlog, raised guidance
- Price: 30% off highs at multi-year support
- Trigger: hold above $273–$285; target $337–$346; stop below $270
- Not financial advice. Do your own research and manage your risk.
G
AMCR : LONG SWING TRADE - NEW POSITION
Stock : AMCR
Side : Long
Entry : 42.39
Qty : 600
Follow the trades on sheet: https://shorturl.at/kxhUW
Note: All content, trading ideas, signals, setups, open positions, and closed positions in this sheet are for educational and informational purposes only. They should not be construed as financial advice or recommendations to buy or sell any security or specific assets.

A
BIG EVENTS THAT COULD MOVE MARKETS THIS WEEK
Investors have a packed week ahead, with geopolitics, AI, economic data and corporate earnings all in focus.
1️⃣ Trump-Xi Summit 🇺🇸🇨🇳
Trump and Xi are scheduled to meet in Washington on September 24. Trade, tariffs, AI, rare earths and other strategic issues will be closely watched. A key focus is whether the current trade truce can be extended.
2️⃣ Zuckerberg & AI
Meta CEO Mark Zuckerberg is expected to address AI developments as debate intensifies over AI safety, regulation and massive infrastructure spending.
3️⃣ UN General Assembly
World leaders gather in New York with the Middle East conflict, AI and global security among the major issues.
4️⃣ U.S. Flash PMIs
Markets will watch September business activity data for clues about the strength of the U.S. economy.
5️⃣ Costco Earnings
Costco’s quarterly results will provide another look at U.S. consumer spending and inflation pressures.
Bottom line: Trade policy, AI spending, economic growth and consumer demand could shape market sentiment this week.

J
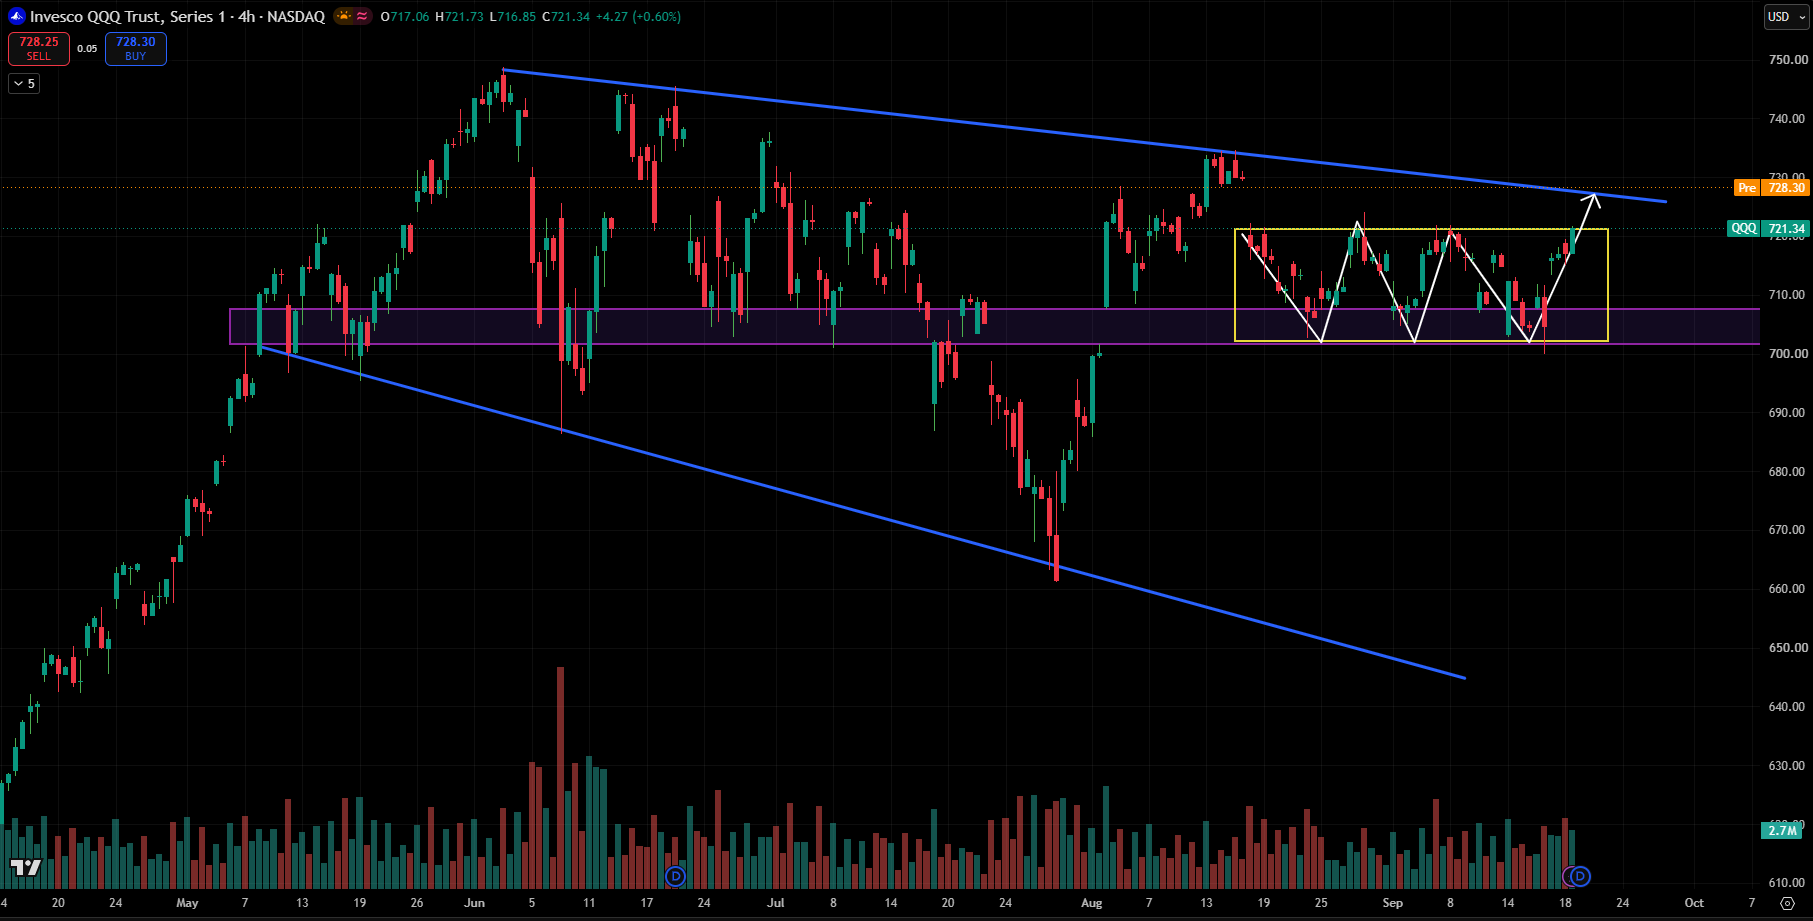
QQQ Nears Major Trendline Resistance - Breakout or Rejection? Building Bullish Pressure!
- Structure: QQQ is consolidating inside a well-defined ~702–721 range after recovering sharply from the August low.
- Key resistance: 721–723 is the immediate breakout zone, while the major descending trendline sits around 728–730.
- Bullish setup: Price has formed a series of swings around the 702–721 range, with buyers repeatedly defending the 702–705 support. A sustained 4H close above 721–723 would strengthen the upside setup.
- Upside levels: A breakout can open the way toward 728–730, where the descending trendline becomes the next major test. Above that, 735–740 becomes relevant.
- Bearish scenario: Failure around 721–730 followed by a rejection could send QQQ back toward 710, then the critical 702–705 support.
- Overall: Range-bound with a bullish breakout attempt, but the larger descending trendline means 728–730 is the key confirmation area rather than assuming the breakout is complete.
G
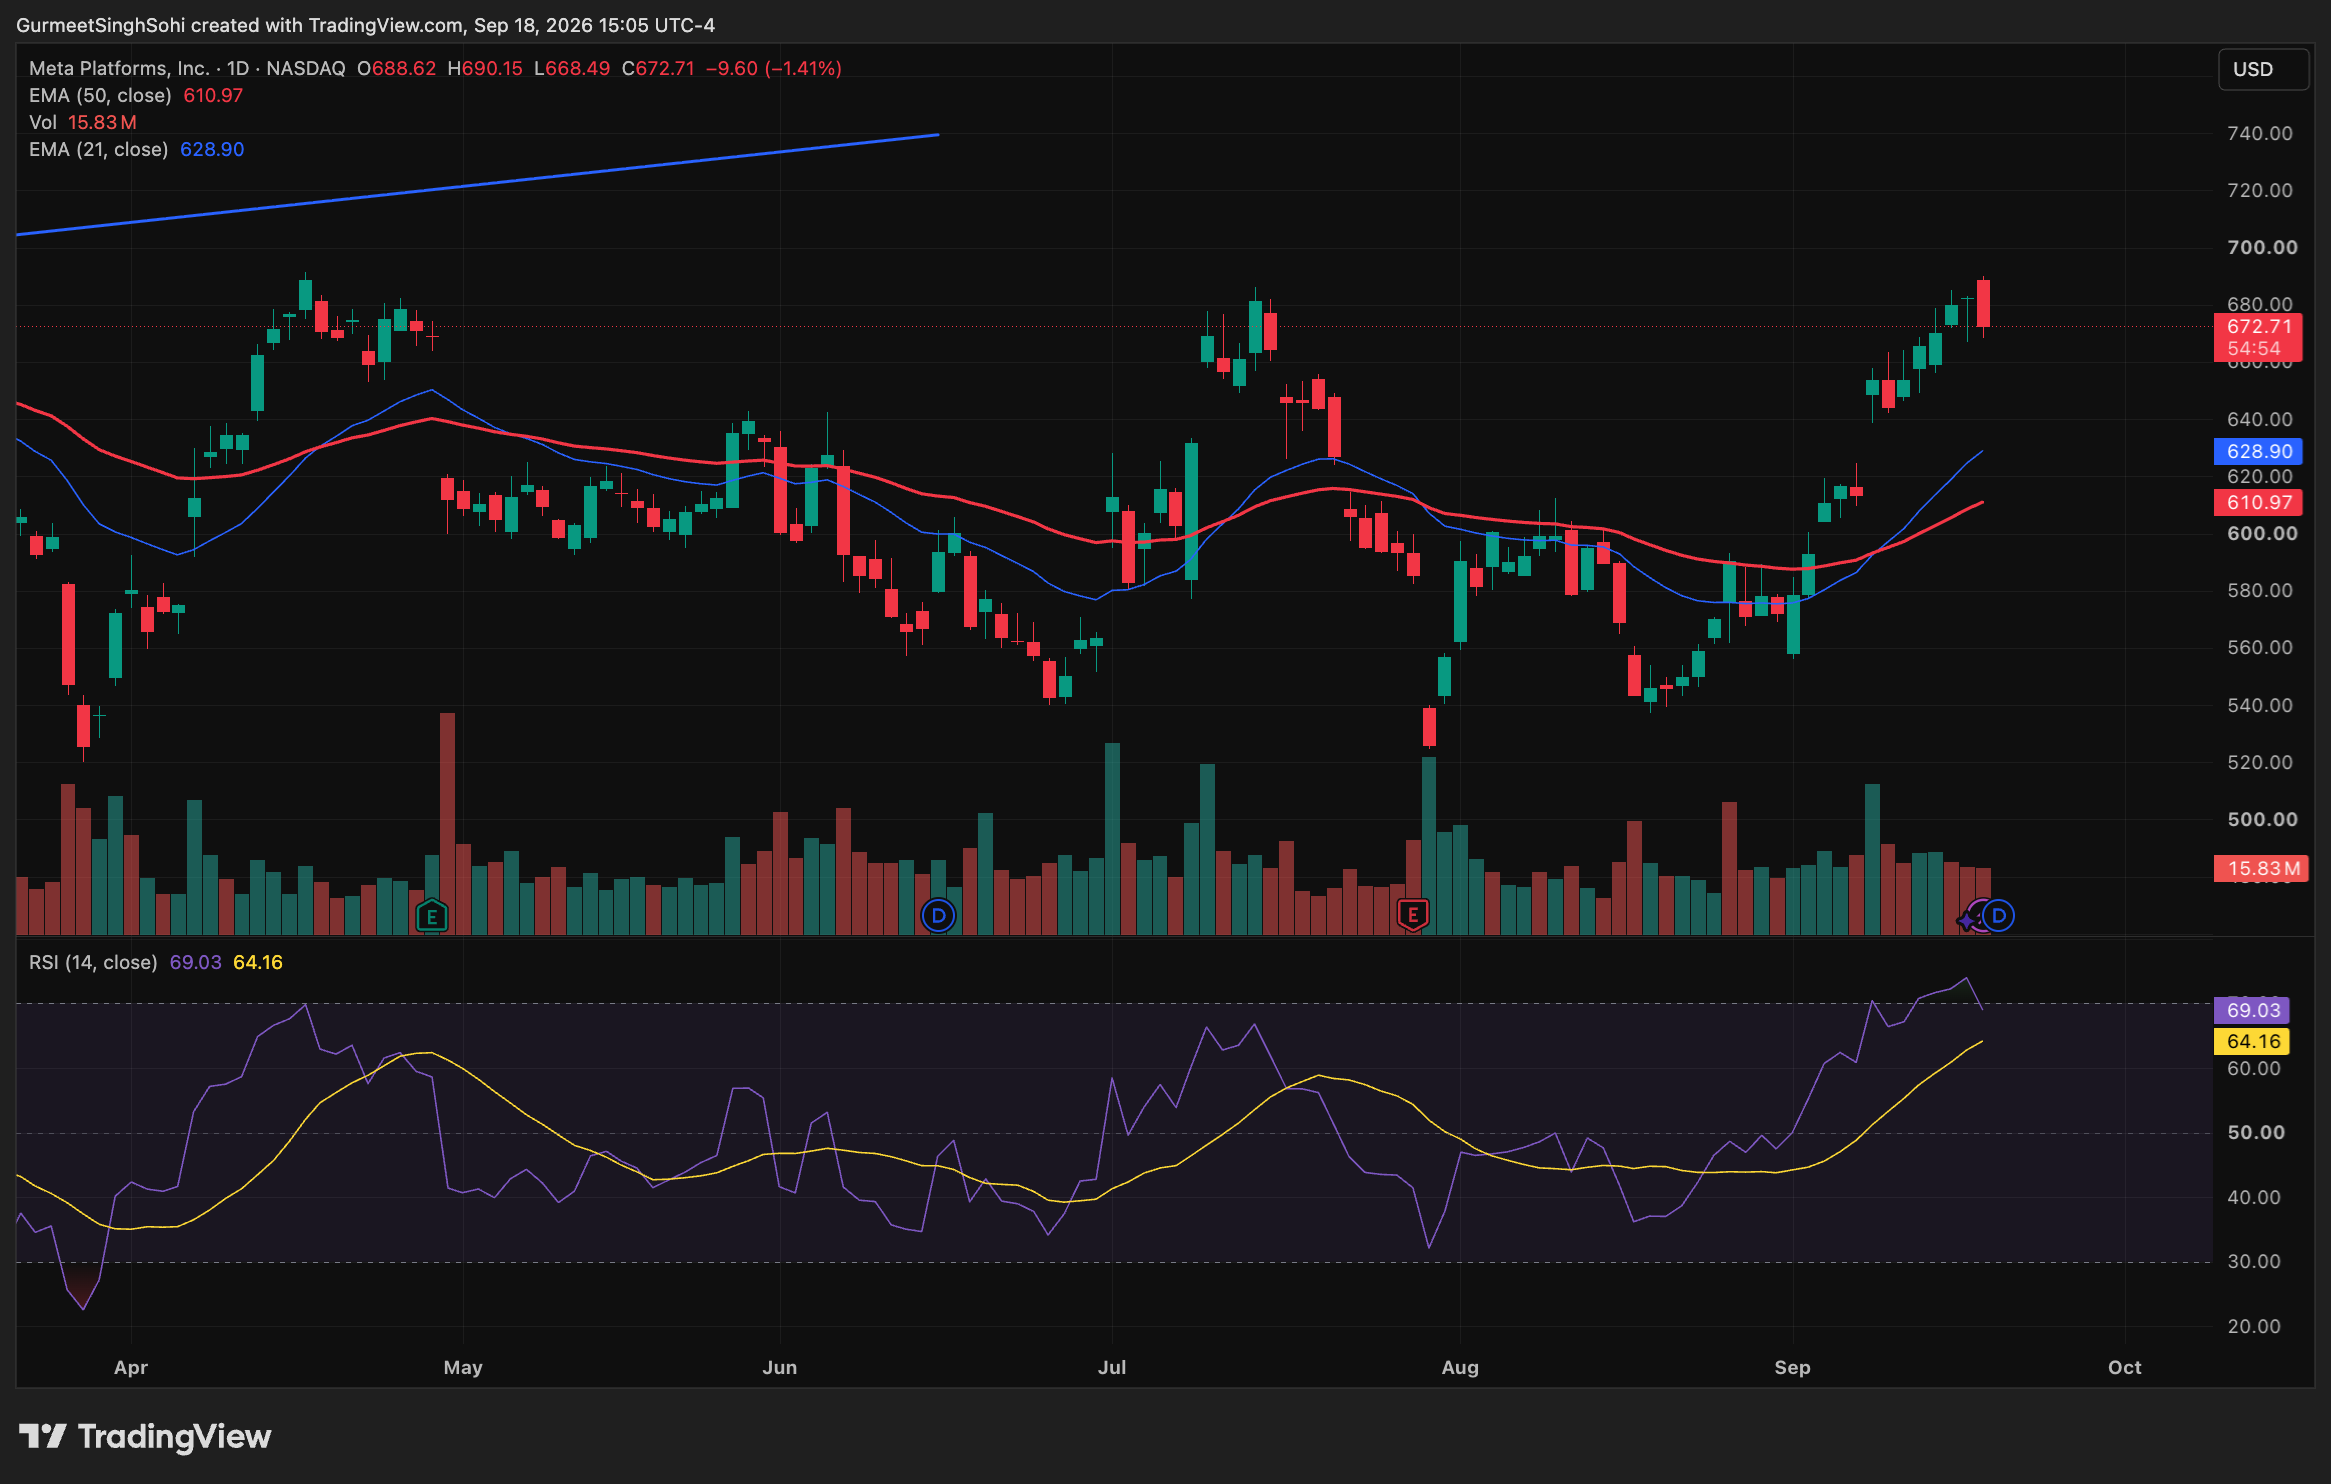
SWING TRADE - NEW POSITION IN META
SWING TRADE - NEW POSITION
Stock : META
Side : Short
Entry : 673.50
Qty : 50
Follow the trades on sheet: https://shorturl.at/kxhUW
Note: All content, trading ideas, signals, setups, open positions, and closed positions in this sheet are for educational and informational purposes only. They should not be construed as financial advice or recommendations to buy or sell any security or specific assets.
J
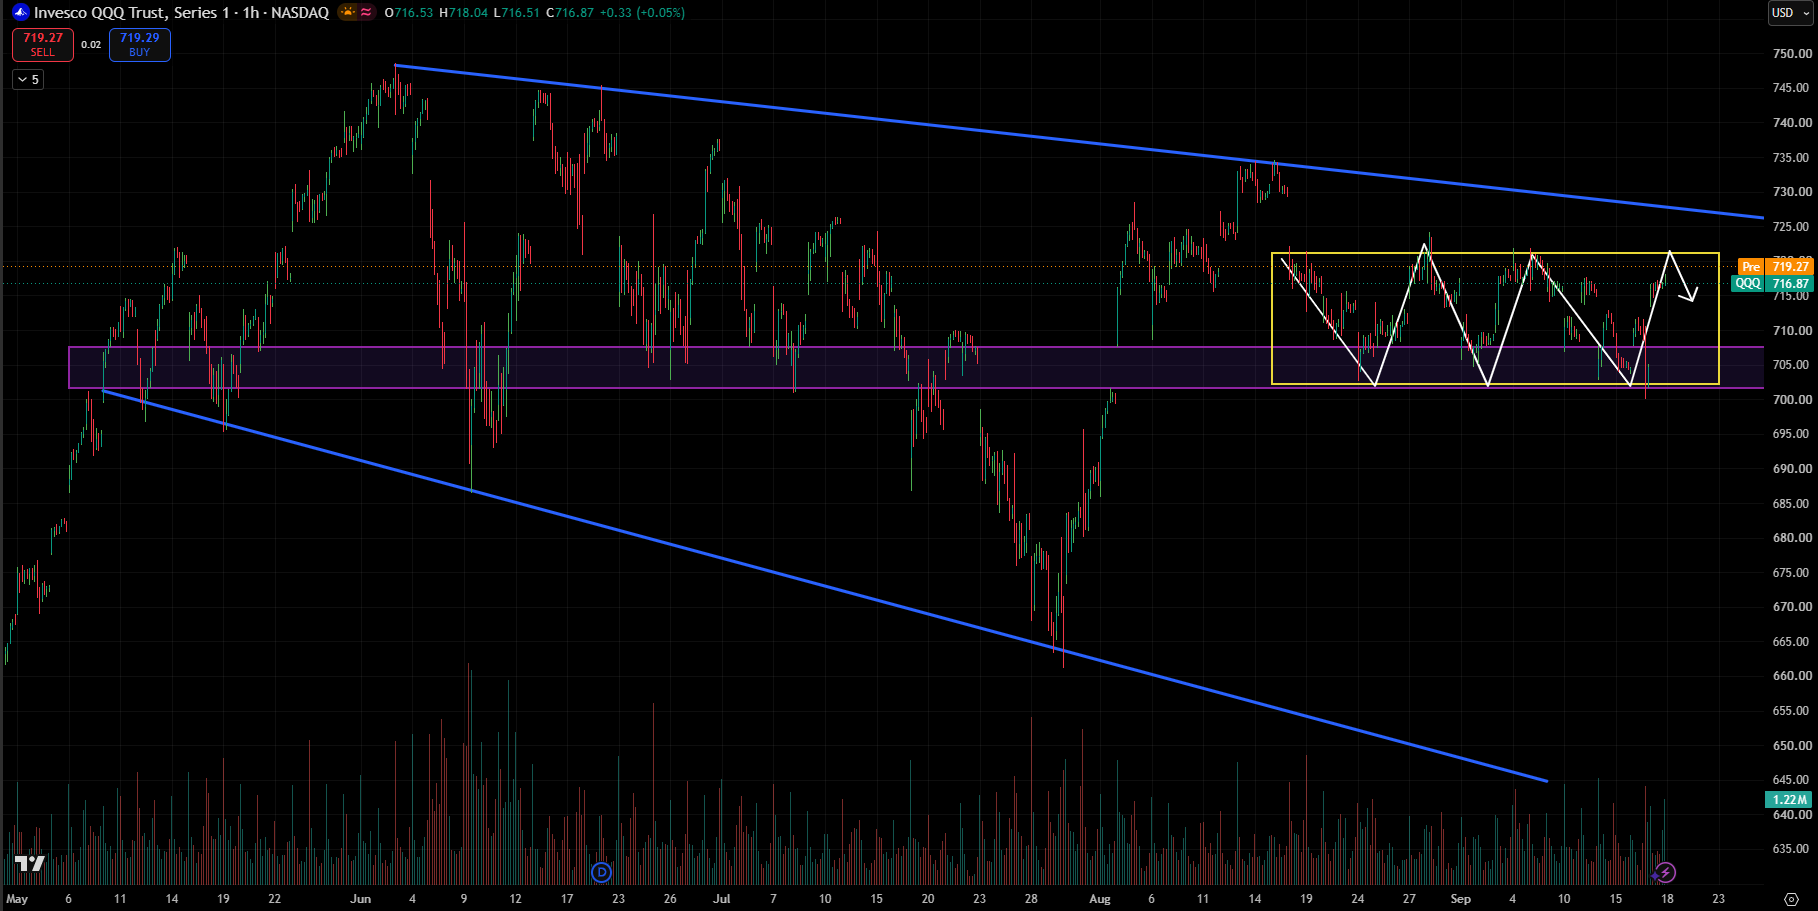
QQQ Bulls Are Testing the Ceiling - What Happens Next?, Breakout or CRASH?
- Structure: QQQ remains range-bound inside the 702–723 consolidation zone, with repeated swings between support and resistance.
- Resistance: 719–723 is the immediate supply zone. A sustained breakout above 723 would challenge the larger descending trendline around 730–735.
- Support: 707–702 is the key demand zone; repeated reactions from this area make it important for the current structure.
- Price action: The latest bounce from ~702 has pushed QQQ back toward 717, but momentum has not yet produced a confirmed range breakout.
- Bearish scenario: Rejection around 719–723 followed by a break below 707/702 would weaken the range structure and expose lower levels.
- Bullish scenario: Holding above 707 and breaking/closing above 723 would shift the near-term structure toward 730–735.
Key levels: 723 → 730–735 upside | 707 → 702 downside.
G
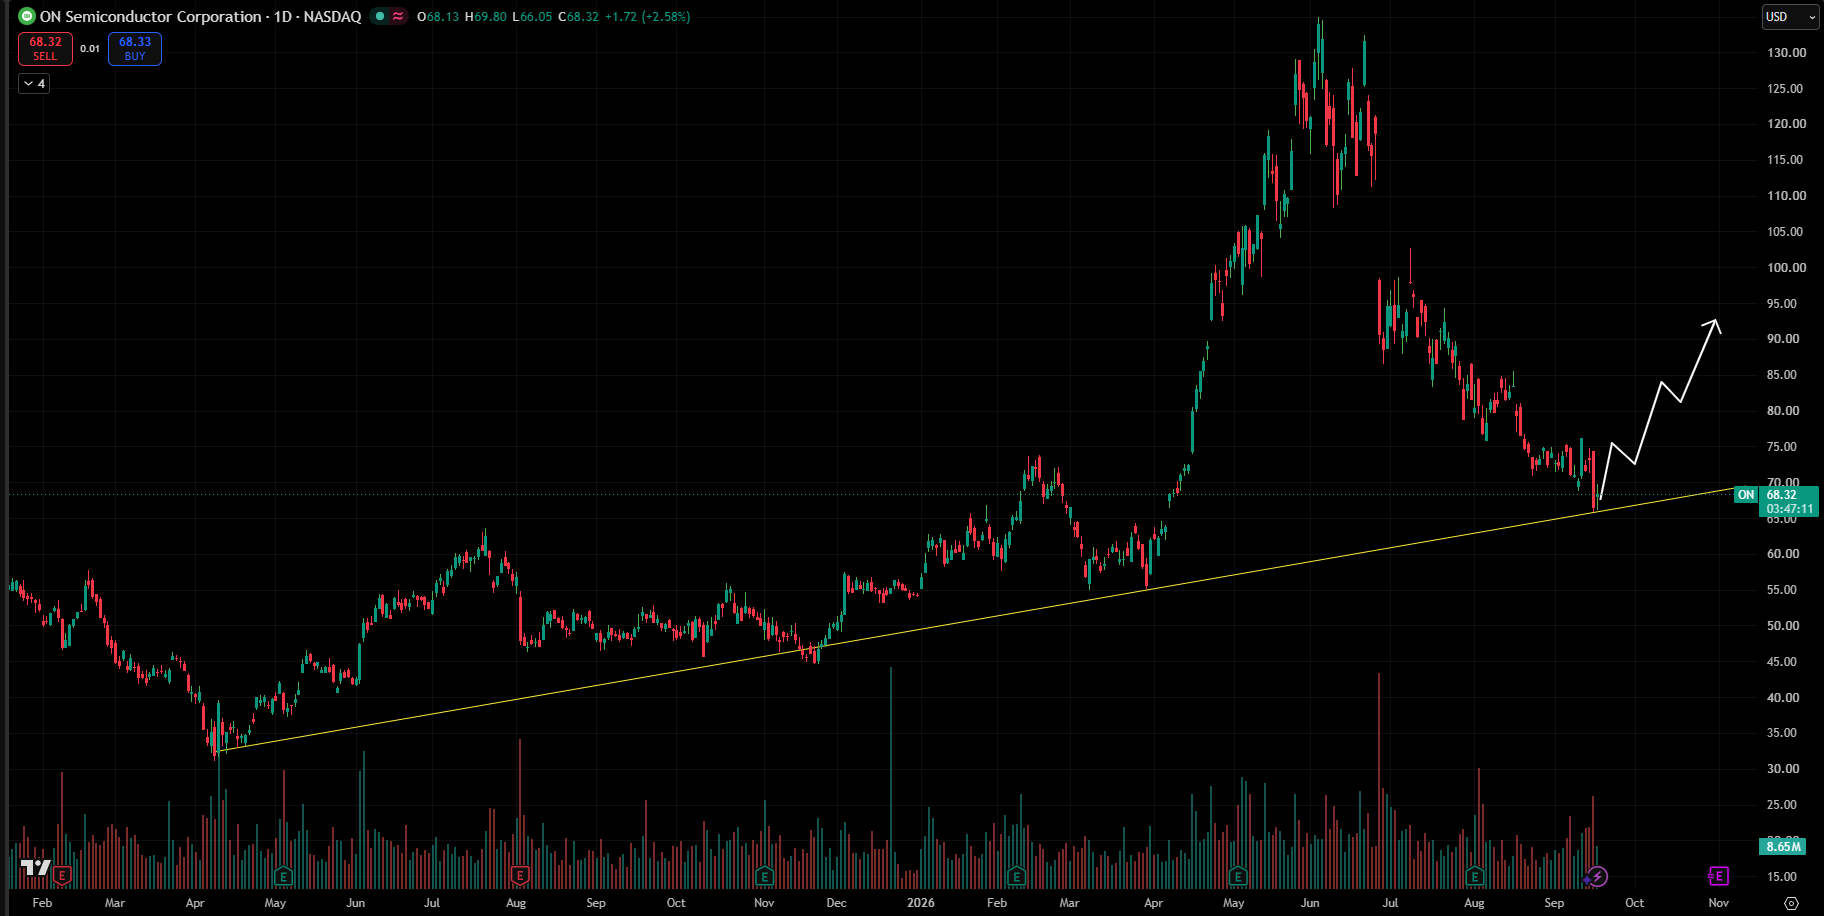
SWING TRADE - NEW POSITION : ON
Stock : ON
Side : Long
Entry : 68.30
Qty : 400
Follow the trades on sheet: https://shorturl.at/kxhUW
Note: All content, trading ideas, signals, setups, open positions, and closed positions in this sheet are for educational and informational purposes only. They should not be construed as financial advice or recommendations to buy or sell any security or specific assets.
J
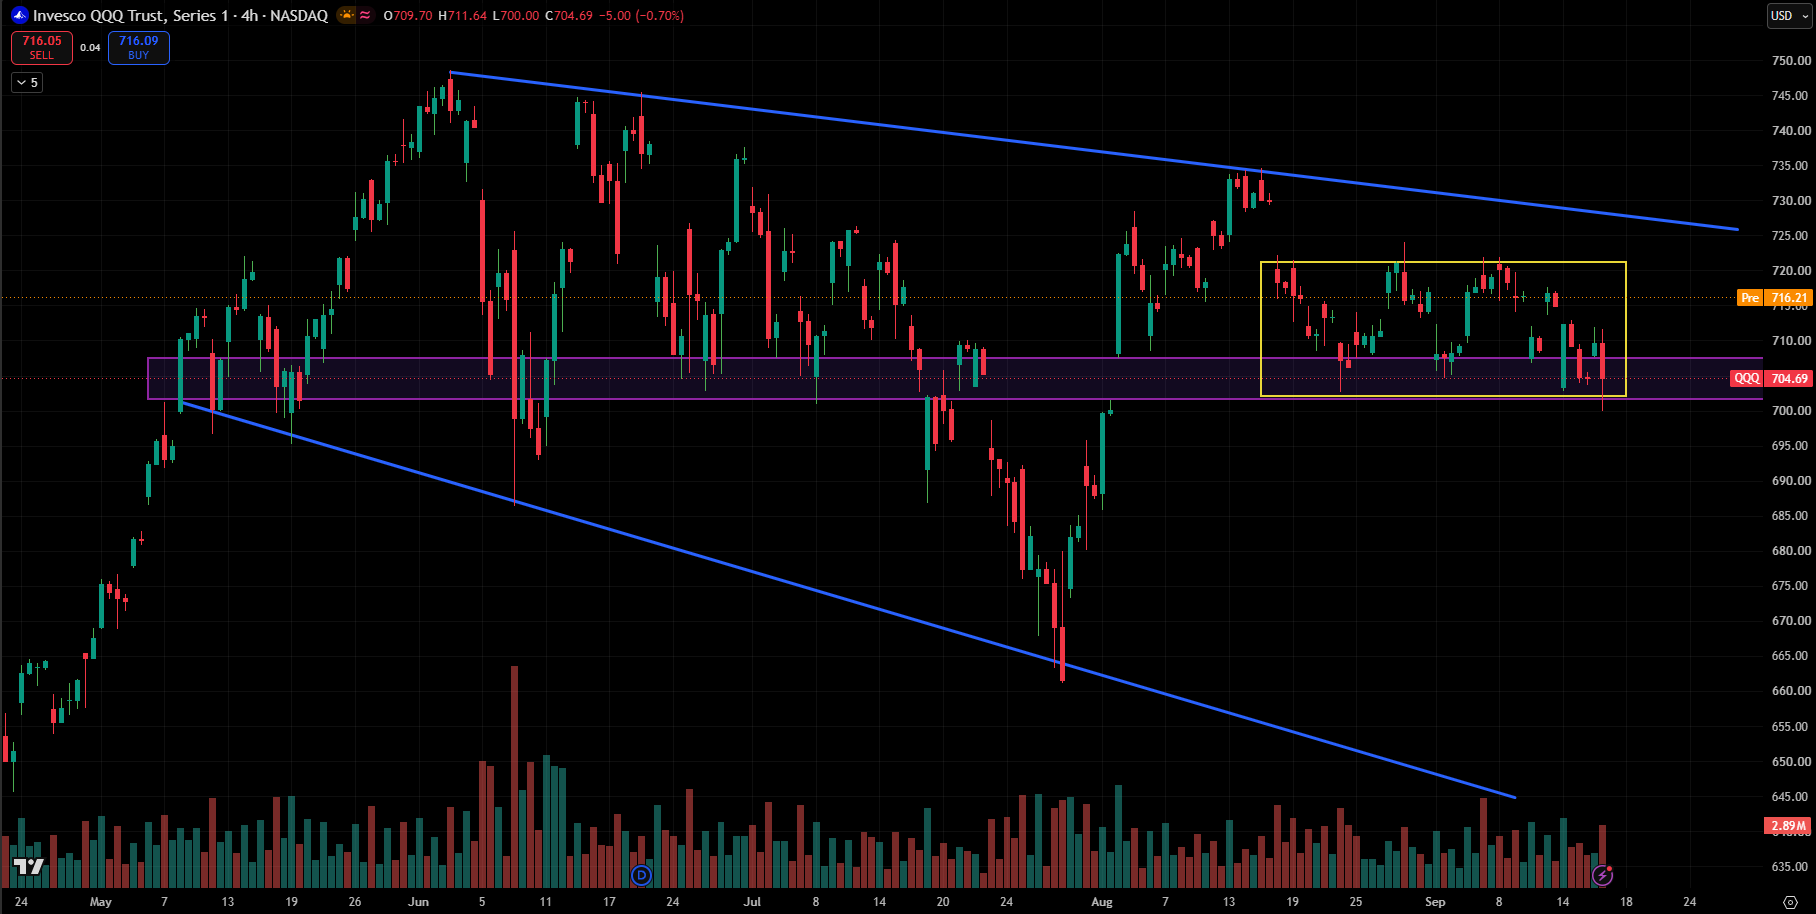
NASDAQ (QQQ) Trapped in a Tight Range - Breakout or Breakdown Next?
- QQQ remains range-bound between ~$704–722, with price currently near the lower boundary.
- $702–705 is key support; a strong rejection here could trigger a bounce toward $710–714.
- $720–722 remains major resistance and the range ceiling.
- A 4H close below $702 could signal range breakdown, exposing ~$695–690.
- A 4H breakout above $722 would invalidate the range setup and open room toward $730–735.
- Until a confirmed breakout/breakdown, buy near support and sell near resistance remains the range-trading framework.
- Volume is not showing a decisive breakout, supporting the ongoing consolidation/range structure.
- The descending trendline overhead keeps the broader setup cautious, so confirmation outside $702–722 is important before expecting a larger directional move.
G
SWING TRADE - NEW POSITION IN PEP
SWING TRADE - NEW POSITION
Stock : PEP
Side : Long
Entry :134.54
Qty : 300
Follow the trades on sheet: https://shorturl.at/kxhUW
Note: All content, trading ideas, signals, setups, open positions, and closed positions in this sheet are for educational and informational purposes only. They should not be construed as financial advice or recommendations to buy or sell any security or specific assets.
G
SWING TRADE - NEW POSITION IN CRCL
SWING TRADE - NEW POSITION
Stock : CRCL
Side : Long
Entry : 80.34
Qty : 500
Follow the trades on sheet: https://shorturl.at/kxhUW
Note: All content, trading ideas, signals, setups, open positions, and closed positions in this sheet are for educational and informational purposes only. They should not be construed as financial advice or recommendations to buy or sell any security or specific assets.
J
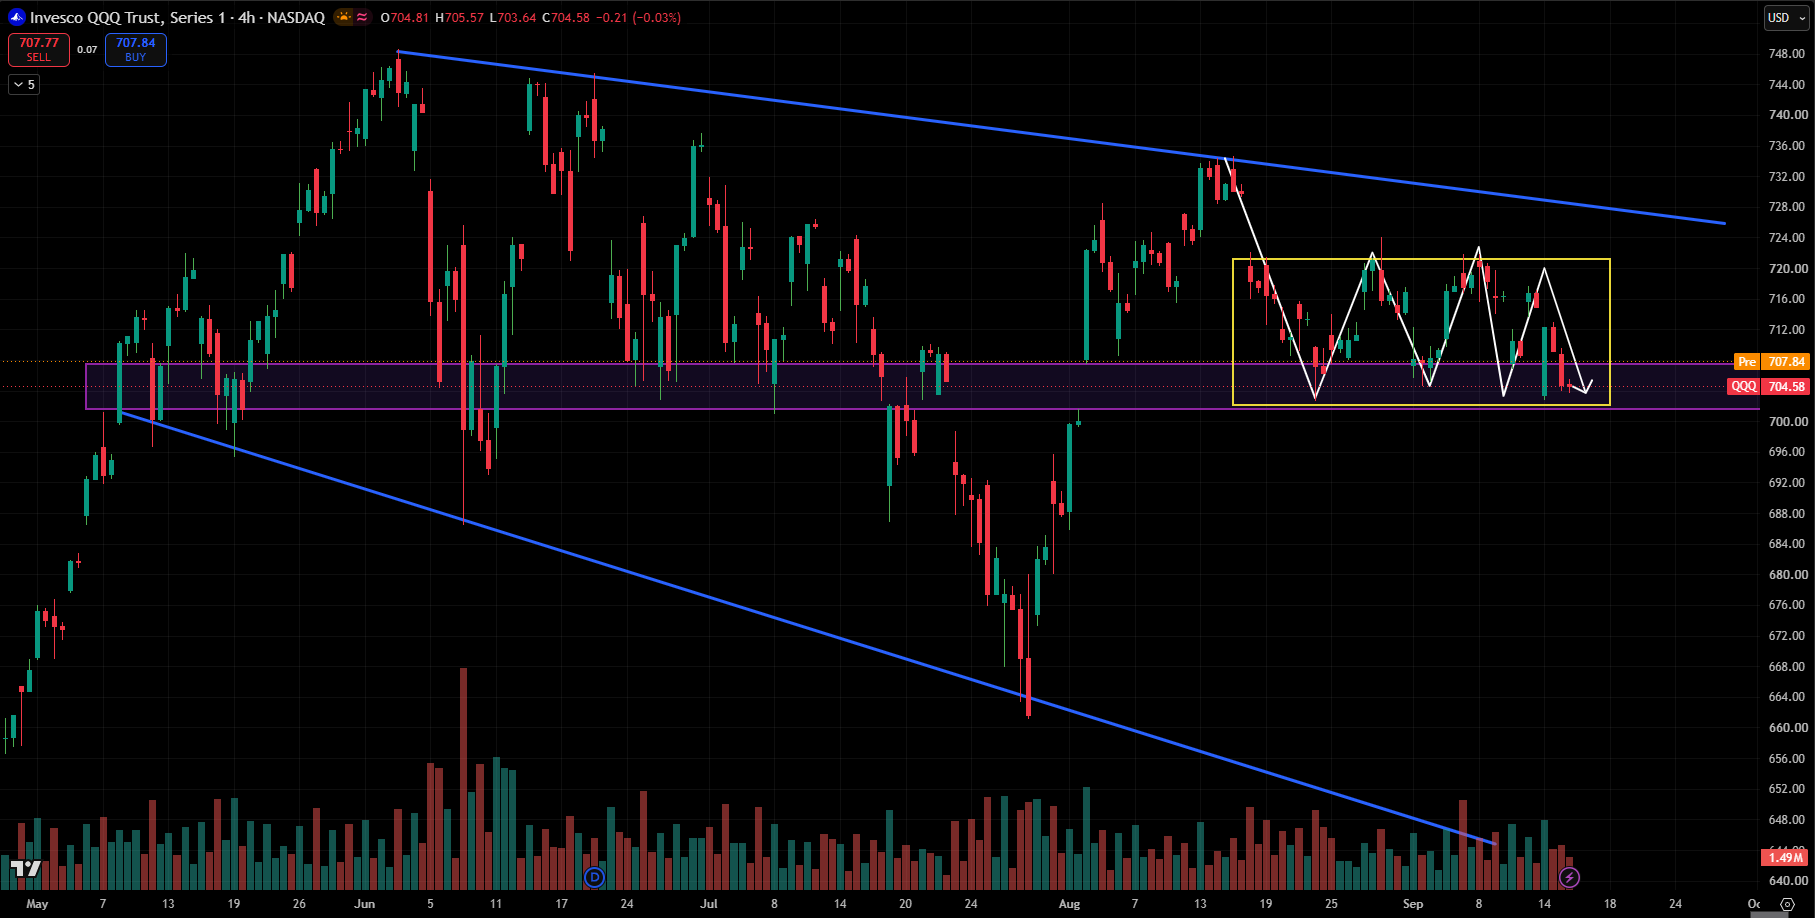
QQQ is sitting at a critical support zone. The $700–702 reaction is the key technical signal: hold = range recovery attempt; break = potential continuation lower.
Key Levels
Resistance: 710 → 715 → 720–722 → 728–730
Support: 703–700 → 696 → 688–690
- Structure: QQQ remains in a short-term bearish/consolidation phase, trading below the descending trendline and below the $710–715 resistance cluster.
- Key Support: $703–700 is the major demand zone. Price is currently testing this area; holding it could keep the range intact.
- Range: QQQ has been consolidating inside roughly $703–722, with repeated failures near the upper boundary.
- Bearish Trigger: A decisive 4H close below $700–702 would weaken the structure and open downside toward $696, followed by $688–690.
- Bullish Trigger: Reclaiming $710–712 would be the first sign of strength, while a breakout above $720–722 could target the descending trendline around $726–730.
- Momentum: Technical readings remain weak; QQQ is below its short-term moving averages, while some oscillators are approaching oversold territory.
- Macro Catalyst: Today’s Fed decision is the major volatility catalyst. Elevated Treasury yields near 5% have been pressuring growth/tech valuations, although yields pulled slightly below 5% ahead of the decision.
J
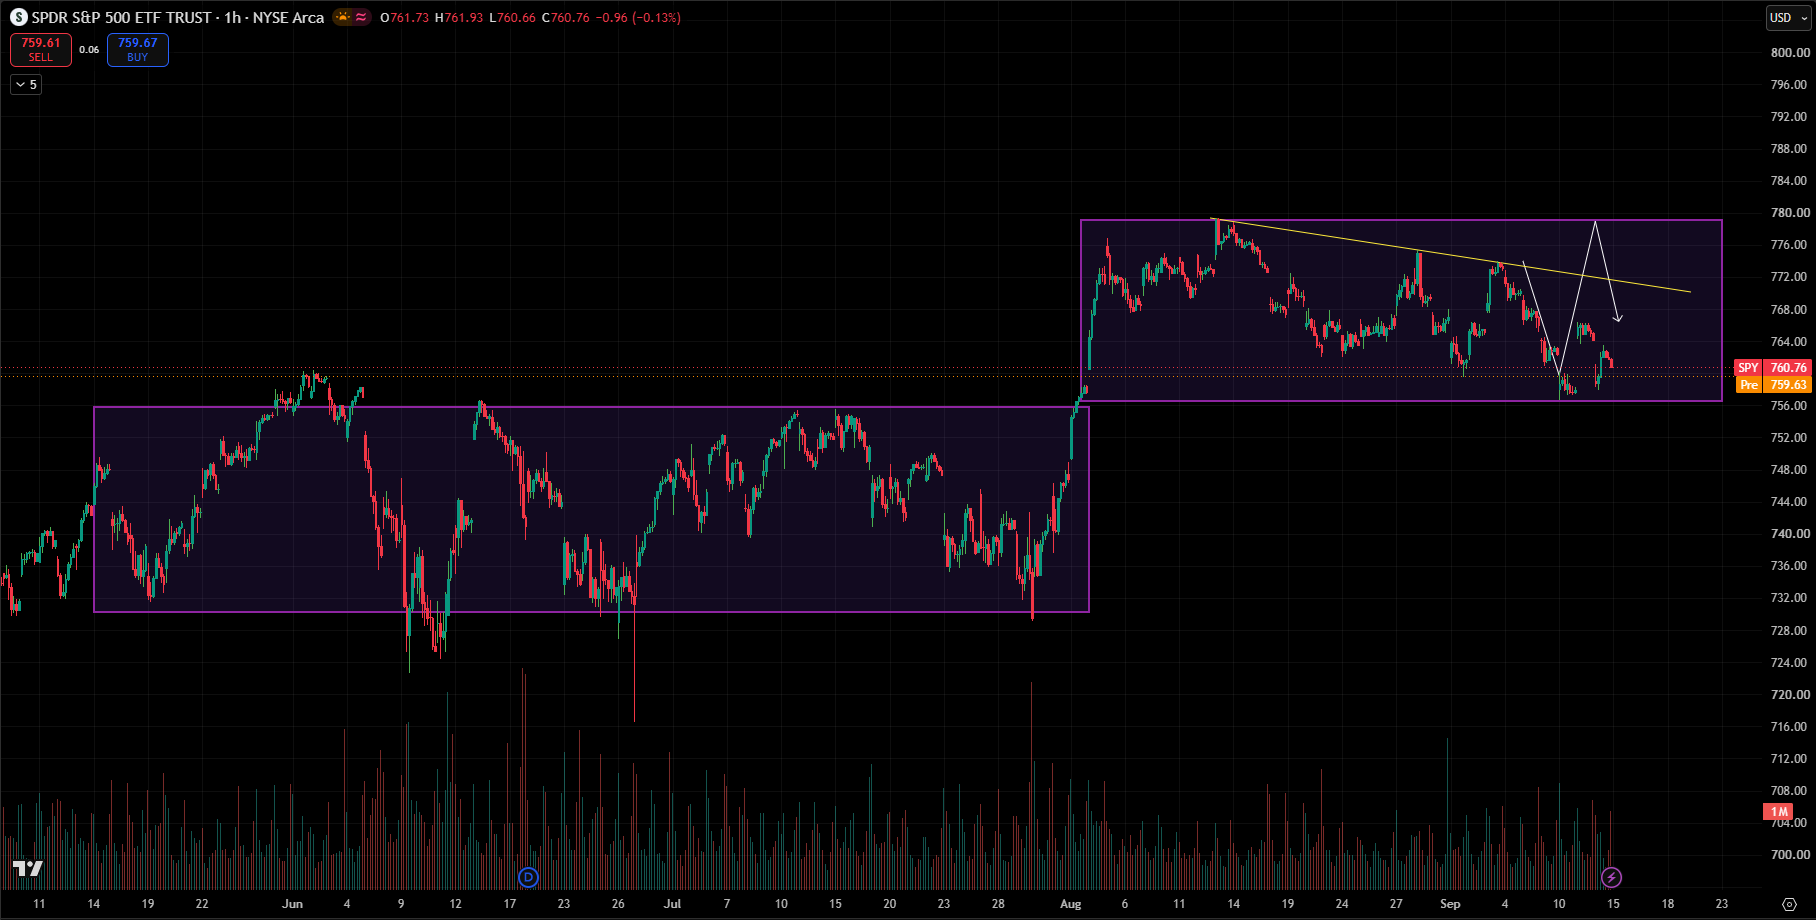
SPY Is Sitting on a Critical Support - Breakdown Risk Rising. The 760 Level Could Decide SPY’s Next Big Move
- SPY is sitting at a critical support zone around 759–760, which is the lower boundary of the current consolidation range.
- Price has been making lower highs beneath the descending trendline, keeping the short-term structure bearish.
- Immediate resistance: 764–766, followed by 768–772 where the descending trendline and prior supply converge.
- Major resistance: 778–780 — the top of the multi-week range. A clean breakout above 780 would invalidate the current bearish setup.
- If 759–760 breaks decisively, downside opens toward 756–754, with the previous breakout area around 752–754 becoming the next key support.
- The bullish scenario requires a reclaim of 768–772; that could trigger a move back toward 778–780.
- Overall: Neutral-to-bearish while below 768–772. SPY is at an important decision point — hold 759–760 = potential bounce; lose it = deeper correction.
G
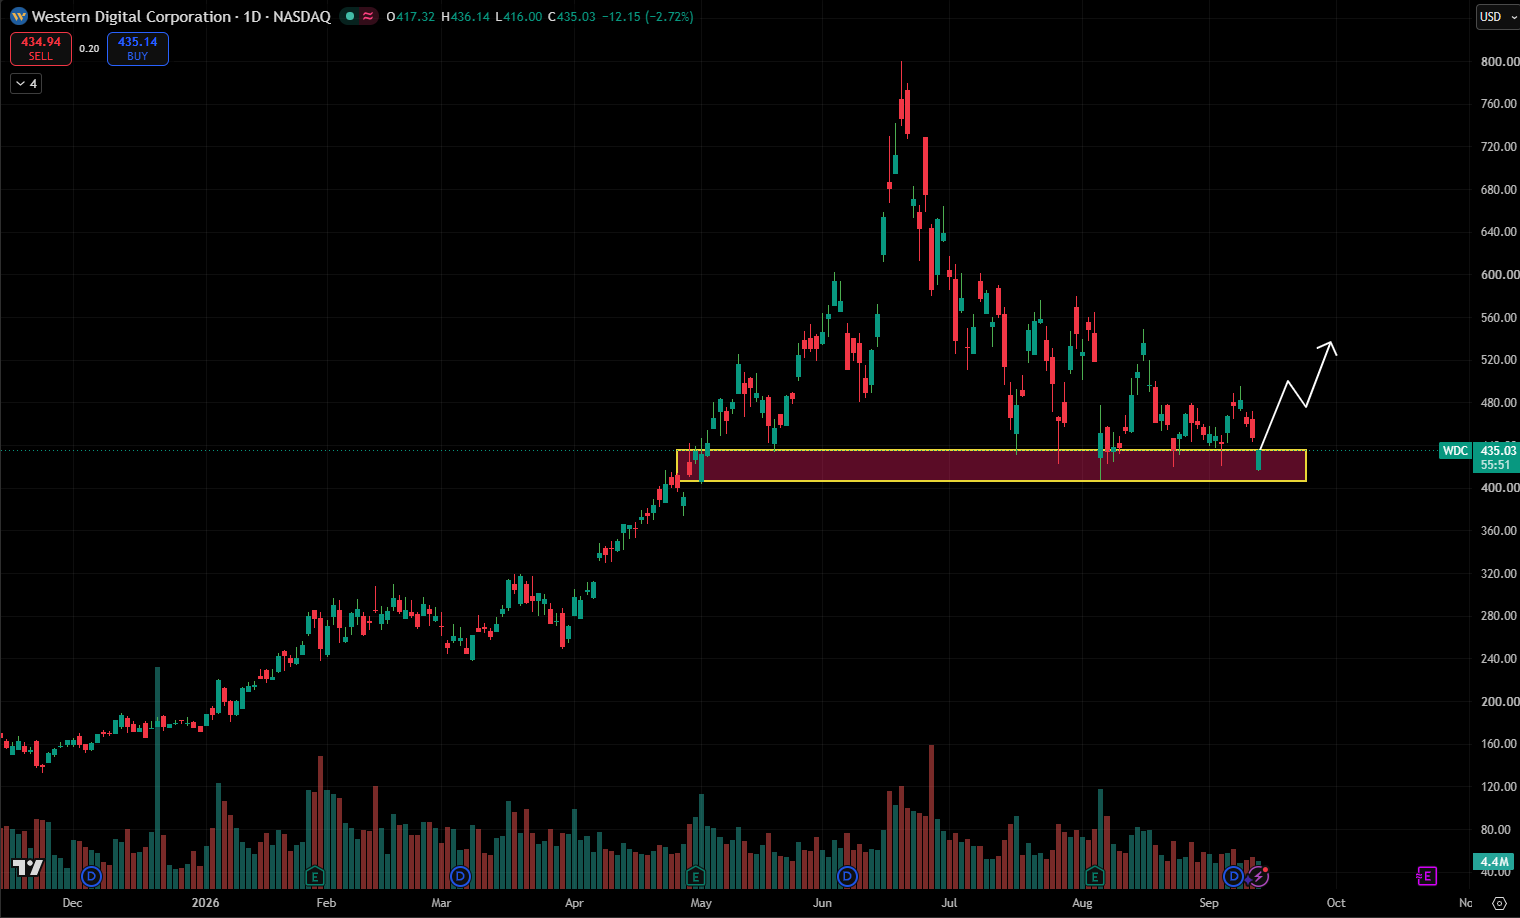
LONG SWING TRADE - NEW POSITION : WDC
Stock : WDC
Side : Long
Entry : 435.50
Qty : 50
Follow the trades on sheet: https://shorturl.at/kxhUW
Note: All content, trading ideas, signals, setups, open positions, and closed positions in this sheet are for educational and informational purposes only. They should not be construed as financial advice or recommendations to buy or sell any security or specific assets.
J
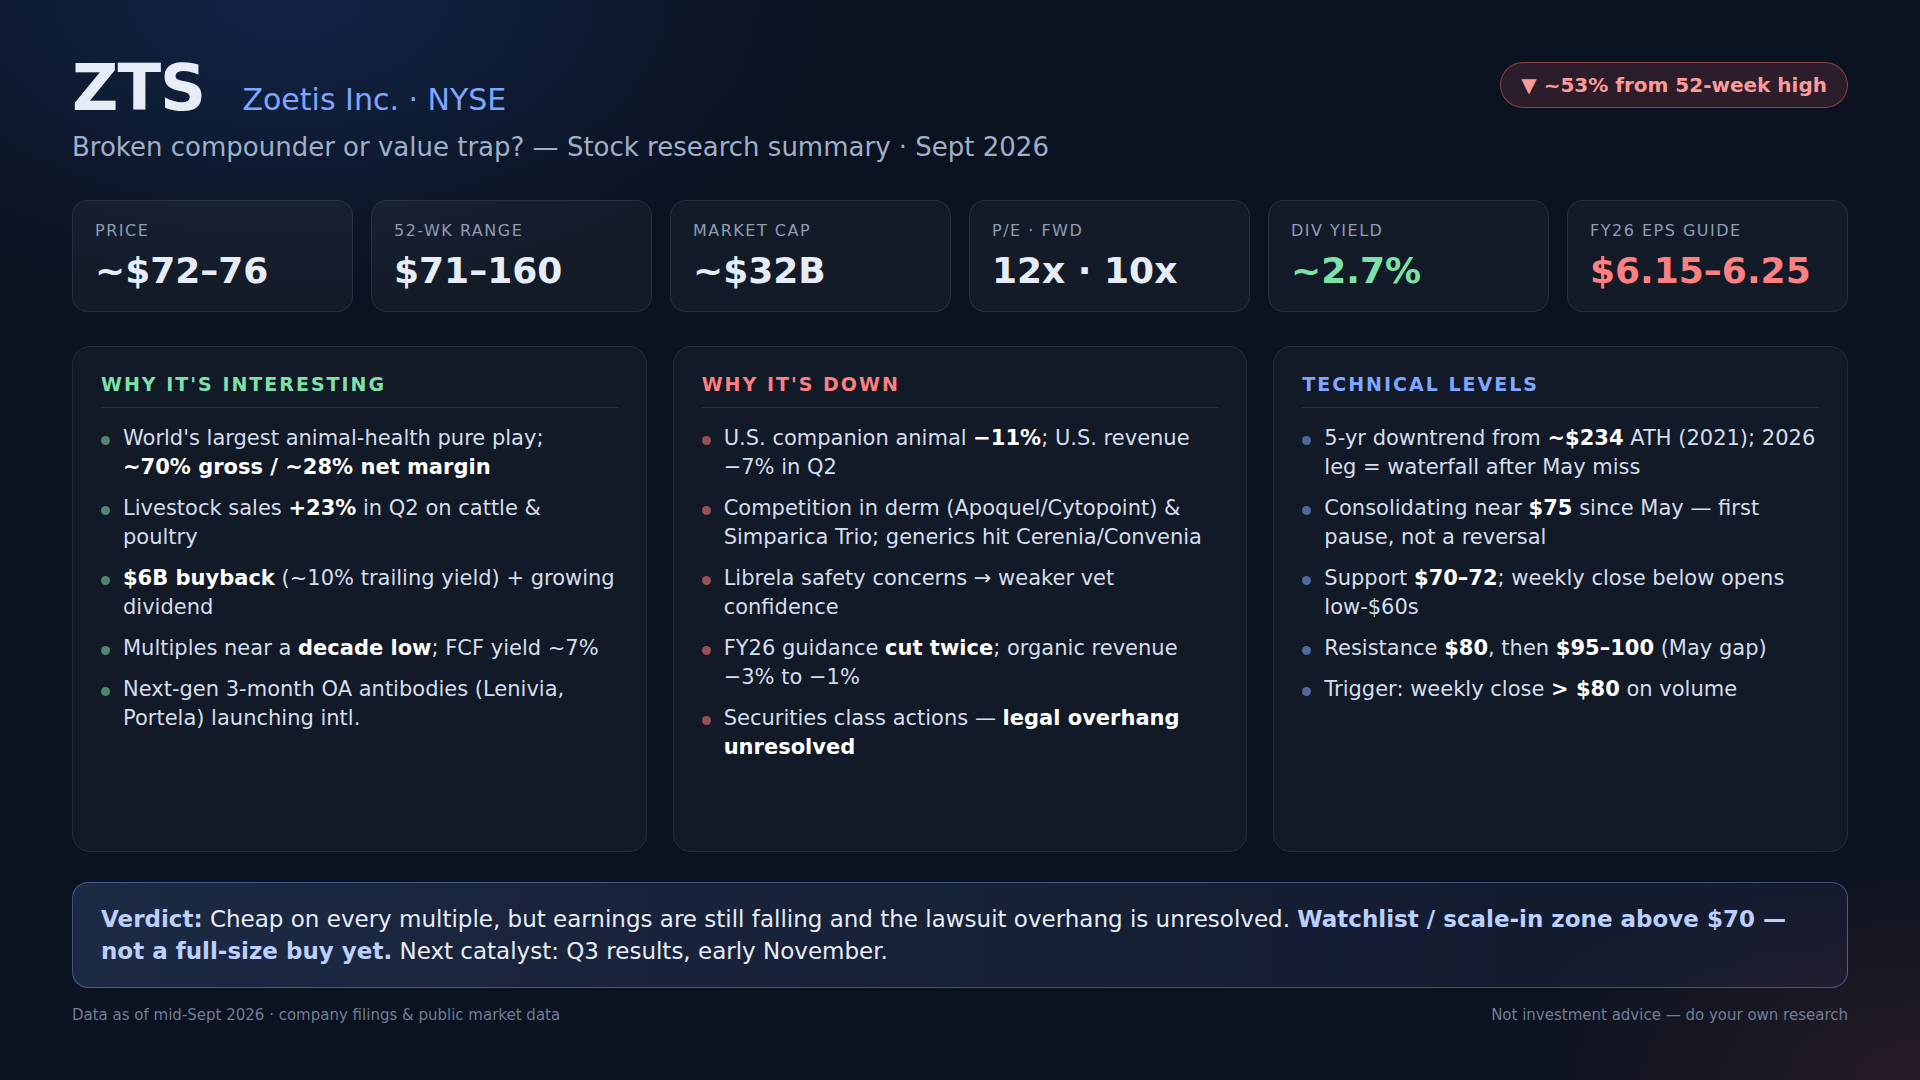
Zoetis (ZTS) Stock Analysis 2026: Down 53% - Value Buy or Value Trap?
Snapshot
- Price: ~$72–76 | 52W: $71–160 | Mkt cap: ~$31–32B
- P/E: ~12x | Fwd P/E: ~10–11x | Div yield: ~2.7%
- FY26 EPS guide: $6.15–6.25 | FCF yield: ~7%
- Verdict: cheap on every multiple, but earnings are still falling and the legal overhang is unresolved — watchlist / scale-in zone above $70, not a full-size buy yet.
Overview
- World's largest pure-play animal health company (pet + livestock medicines, vaccines, diagnostics), headquartered in Parsippany, NJ.
- Stock ~$72–76, near the 52-week low of ~$71 and down roughly 53% from the 52-week high of $160; the all-time high was ~$234 in Dec 2021.
- P/E has compressed from the mid-30s to ~12x - the premium is gone.
Business model
- Two segments: companion animal (dogs/cats/horses — the majority of revenue) and livestock (cattle, swine, poultry, fish).
- Sells through veterinarians; key franchises are dermatology (Apoquel/Cytopoint), parasiticides (Simparica Trio) and OA-pain antibodies (Librela/Solensia).
- Holds roughly 22–28% share of the global companion-animal drug market.
Fundamentals
- Q2 2026: revenue flat at $2.5B, adjusted EPS $1.87 — EPS beat by a cent, revenue slightly light.
- The problem is the U.S.: U.S. revenue fell 7% and companion animal sales fell 11% on softer demand, price sensitivity, competition, and generics hitting Cerenia and Convenia plus lower Librela sales.
- The offset: livestock sales rose 23% on cattle and poultry strength.
- FY26 guidance cut twice: revenue $9.12–9.32B (organic −3% to −1%), adjusted EPS $6.15–6.25.
- Margins still elite — ~70% gross, ~28% net, ROE well above 50%.
Valuation metrics
- ~12x trailing / ~10–11x forward earnings, ~14x FCF, ~7% FCF yield — multiples near a decade low versus its own history.
- Dividend ~2.7% yield ($0.53/qtr), plus a $6B buyback partly funded by $1.75B in convertible notes — ~10% trailing buyback yield.
- Street consensus is Hold; several brokers have cut targets, with recent PTs clustered $80–96.
Technical analysis
- Structure: five-year downtrend from ~$234 (2021 ATH); the 2026 leg was a waterfall after the May Q1 miss — no base built on the way down.
- Consolidating in a tight range near $75 since the May selloff — first pause in the trend, not yet a reversal.
- Support: $70–72 (52-week low zone). A weekly close below it opens the low-$60s.
- Resistance: $80 (post-earnings spike high ~$79.5), then $95–100 (the May gap).
- Trigger: weekly close above $80 on volume for a swing toward the gap; until then it's a range, not a trend trade.
Future growth outlook
- Bull case: international expansion, livestock momentum, and next-gen three-month antibodies Lenivia and Portela, plus a claimed 12+ potential blockbusters in the pipeline.
- Bear case: securities class actions alleging management misled investors on Librela safety and competitive erosion across Simparica Trio, Apoquel, and Cytopoint; U.S. pet spending remains soft.
- Key catalyst: Q3 results in early November - the market wants proof U.S. companion animal spending has stopped shrinking.
G
SWING SHORT TRADE - NEW POSITION : COP
Stock : COP
Side : Short
Entry : 137.40
Qty : 250
Follow the trades on sheet: https://shorturl.at/kxhUW
Note: All content, trading ideas, signals, setups, open positions, and closed positions in this sheet are for educational and informational purposes only. They should not be construed as financial advice or recommendations to buy or sell any security or specific assets.

J
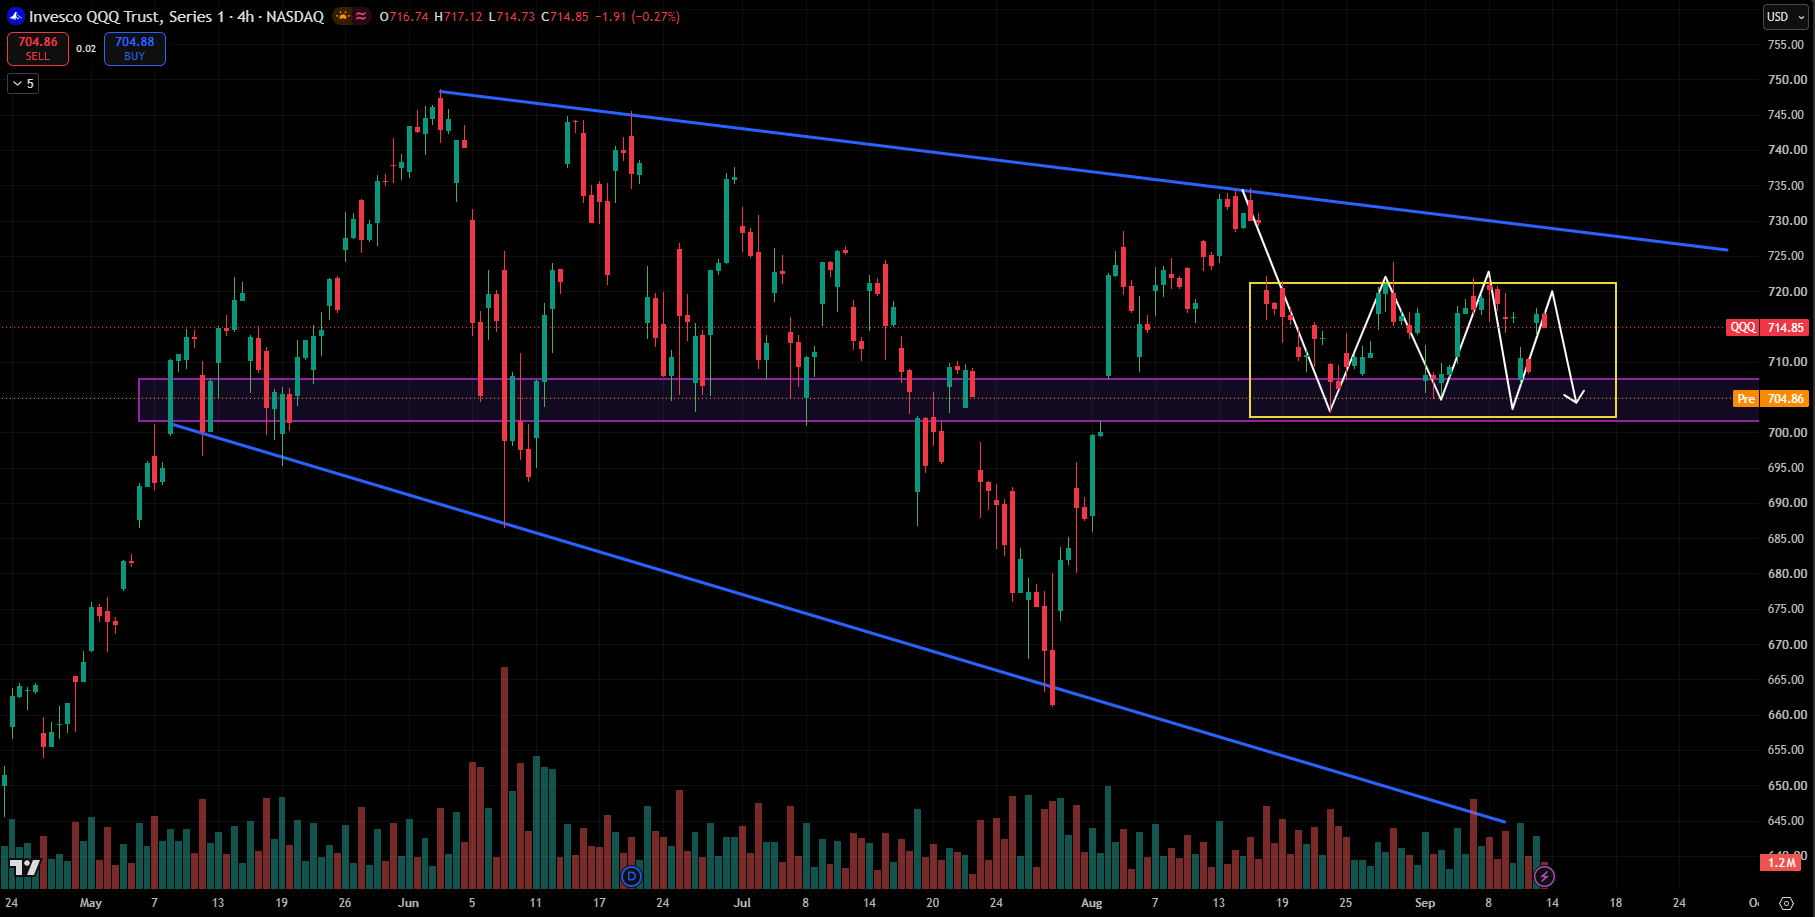
QQQ Trapped in $702–$722 Range. Rejection at Resistance Keeps Bears in Control
Neutral-to-bearish while below $720–722.
The cleanest setup is rejection from $720–722 → $706/$702. Bulls need a convincing breakout above $722 + trendline to regain control.
- Range-bound: QQQ is consolidating inside a clear $702–722 range, with price currently around $714.85.
- Major resistance: $720–722 is the key supply zone. Multiple rejections here indicate sellers are active.
- Trendline resistance: The descending blue trendline is still overhead; QQQ needs a decisive breakout above it to shift the structure bullish.
- Immediate support: $706–704 is the critical support zone. This area has repeatedly attracted buyers.
- Bearish setup: The recent structure shows repeated swings between ~$706 and ~$720, with rejection near the upper boundary. A move back toward $706 → $702 is likely if $712–710 fails.
- Bearish confirmation: A 4H close below $702 would break the range and open downside toward $695–690, potentially lower.
- Bullish invalidation: A strong 4H close above $722, followed by acceptance above the descending trendline, would invalidate the range-bearish setup and target $730–735.
J
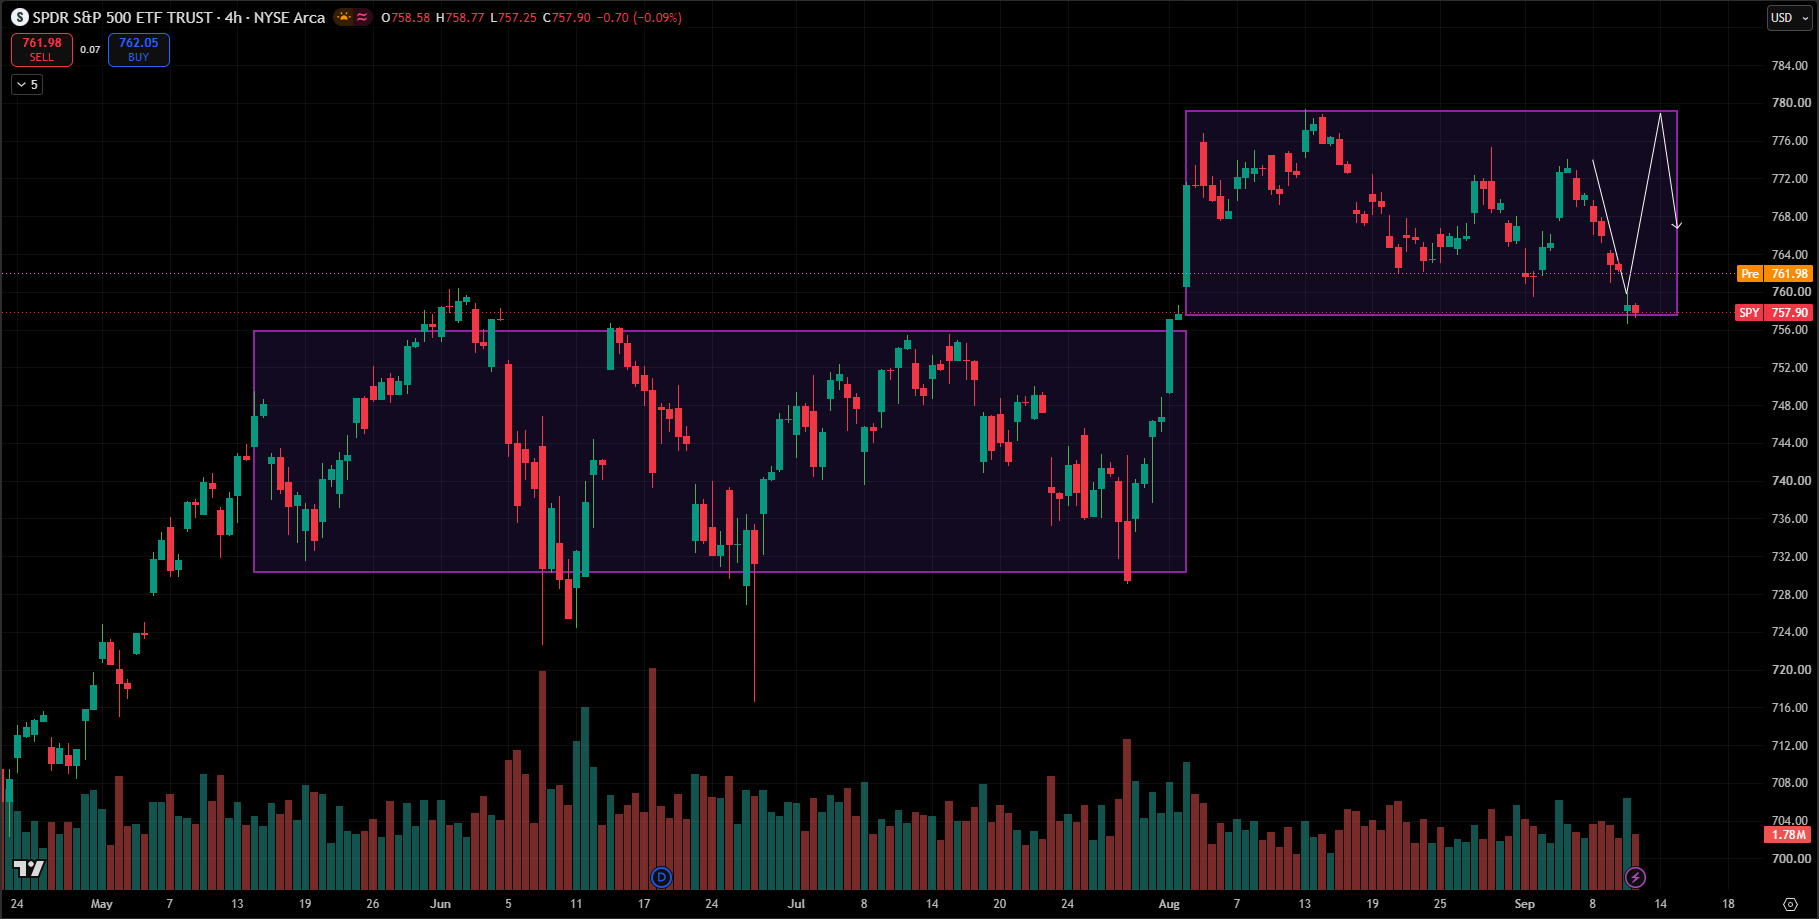
SPY Tests Key 756 Support - Breakout Under Pressure as SPY Hits Support.
- Structure: SPY broke out of the previous 730–756 consolidation range and rallied toward 779, establishing a new higher trading range.
- Current setup: Price is now at 757.90, testing the old 756 breakout resistance, which has become the most important near-term support.
- Support: 756–758 is critical. Holding this zone and getting a 4H close back above 762–764 would favor a rebound.
- Resistance: 768–770 is the first major hurdle, followed by 775–779, the range high. A clean breakout above 779 would signal continuation higher.
- Bearish trigger: A decisive 4H close below 756 would weaken the breakout structure and increase the probability of a move toward 752 → 748 → 740.
- Bullish scenario: If 756 holds, expect a bounce toward 768, then potentially 775–779. Strong volume on the rebound would make this setup more convincing.
- Overall: Bullish-to-neutral at 758, but this is a critical retest. 756 is the line in the sand—holding it keeps the breakout intact; losing it risks a false-breakout reversal.
G
SWING SHORT TRADE - NEW POSITION : BG
Stock : BG
Side : Short
Entry : 125.20
Qty : 250
Follow the trades on the sheet:https://shorturl.at/kxhUW
Note: All content, trading ideas, signals, setups, open positions, and closed positions in this sheet are for educational and informational purposes only. They should not be construed as financial advice or recommendations to buy or sell any security or specific assets.

J
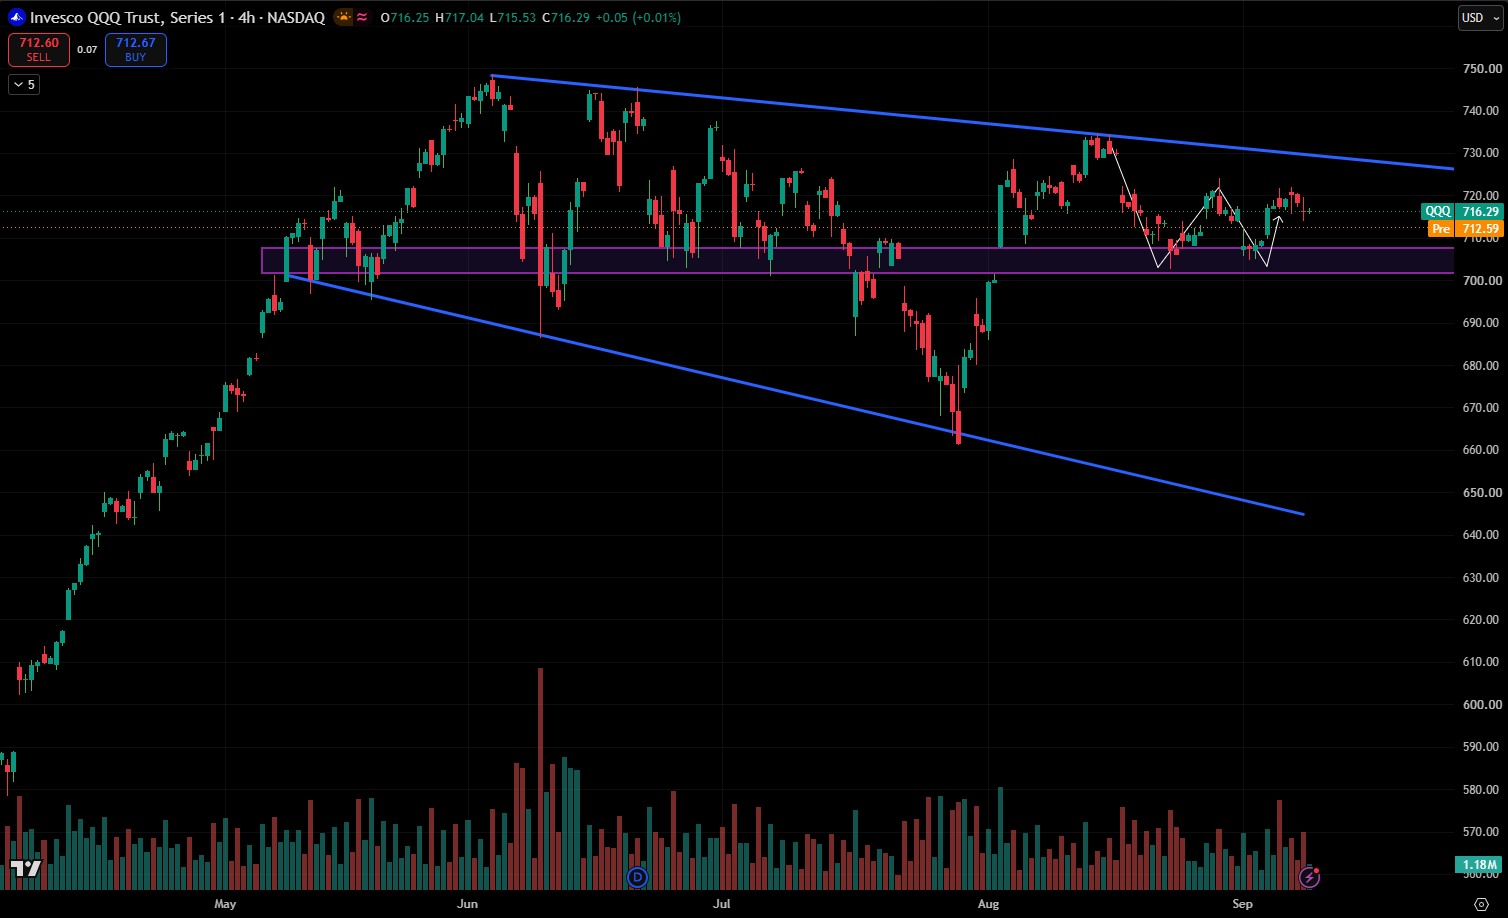
QQQ Rebounds From $700 Support, But Descending Trendline Near $730 Caps Upside.
- Structure: QQQ remains in a broad consolidation/channel, with price repeatedly rejected from the descending resistance trendline. The bigger structure is still range-bound rather than a confirmed breakout.
- Current setup: Price around $716 is sitting in the middle-upper part of the range after bouncing from the $701–705 demand zone. Buyers are attempting another push higher.
- Immediate resistance: $720–723 is the first hurdle. A sustained 4H close above this zone would strengthen the bullish case.
- Major resistance: $726–730 aligns with the descending blue trendline. This is the key breakout area; reclaiming it could open $735 → $742–748.
- Support: $710–712 is the first short-term support. Below that, $701–705 remains the major demand zone and has produced multiple reactions.
- Bearish scenario: Failure around $720–730, followed by a break below $701, would invalidate the current bullish recovery and expose $690 → $680.
- Bias: Neutral-to-bullish above $705, but the chart remains range-bound until $730 is decisively broken. The compression suggests a larger move is building; current QQQ technical commentary also identifies the ~$700–745 region as the broader range.
J
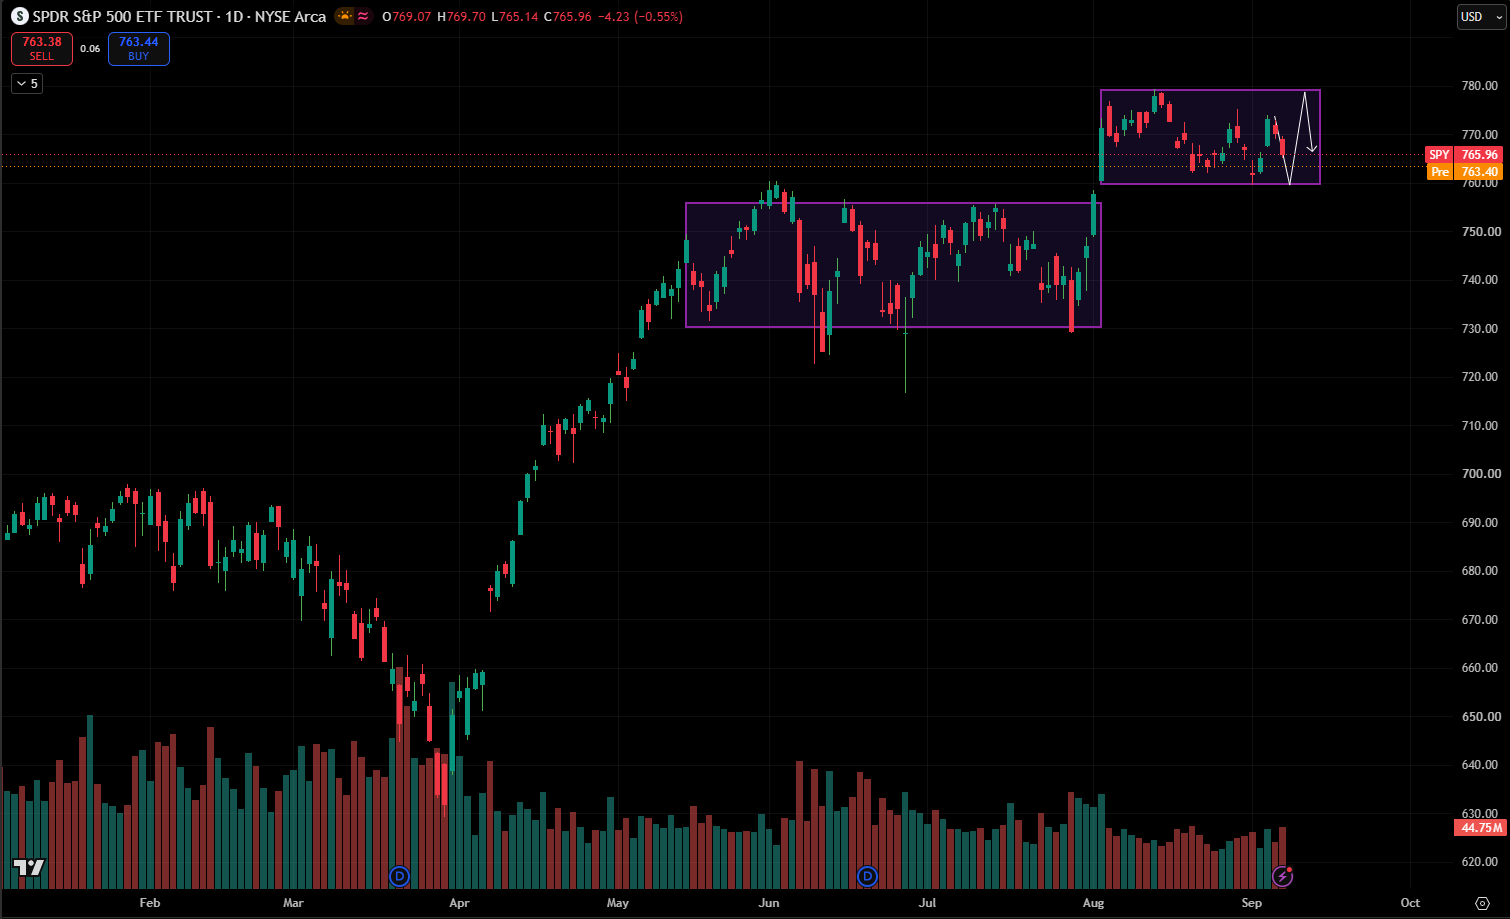
SPY Consolidation: Breakout or Breakdown Ahead? Faces Key Decision Near $760–$780
- Range-bound: SPY remains in a tight consolidation zone between $760–$780 after the strong August breakout.
- Resistance: $775–$780 is the key supply zone; repeated rejection here keeps upside capped.
- Support: $760–$763 is immediate support. A break below $760 could trigger a deeper correction.
- Current setup: Price at $765.96 is near the lower half of the range, showing short-term weakness.
- Bearish scenario: Failure to reclaim $770–$775 → retest of $760, with $755–$750 next if support breaks.
- Bullish scenario: Strong close above $780 would confirm a range breakout and open the way toward $790–$800.
- Bias: Neutral-to-bearish short term while below $775; the broader trend remains bullish unless $760 breaks decisively.
G
SWING SHORT TRADE - NEW POSITION : CVX
Stock : CVX
Side : Short
Entry : 210.50
Qty : 200
Follow the trades on sheet: https://shorturl.at/kxhUW
Note: All content, trading ideas, signals, setups, open positions, and closed positions in this sheet are for educational and informational purposes only. They should not be construed as financial advice or recommendations to buy or sell any security or specific assets.

G
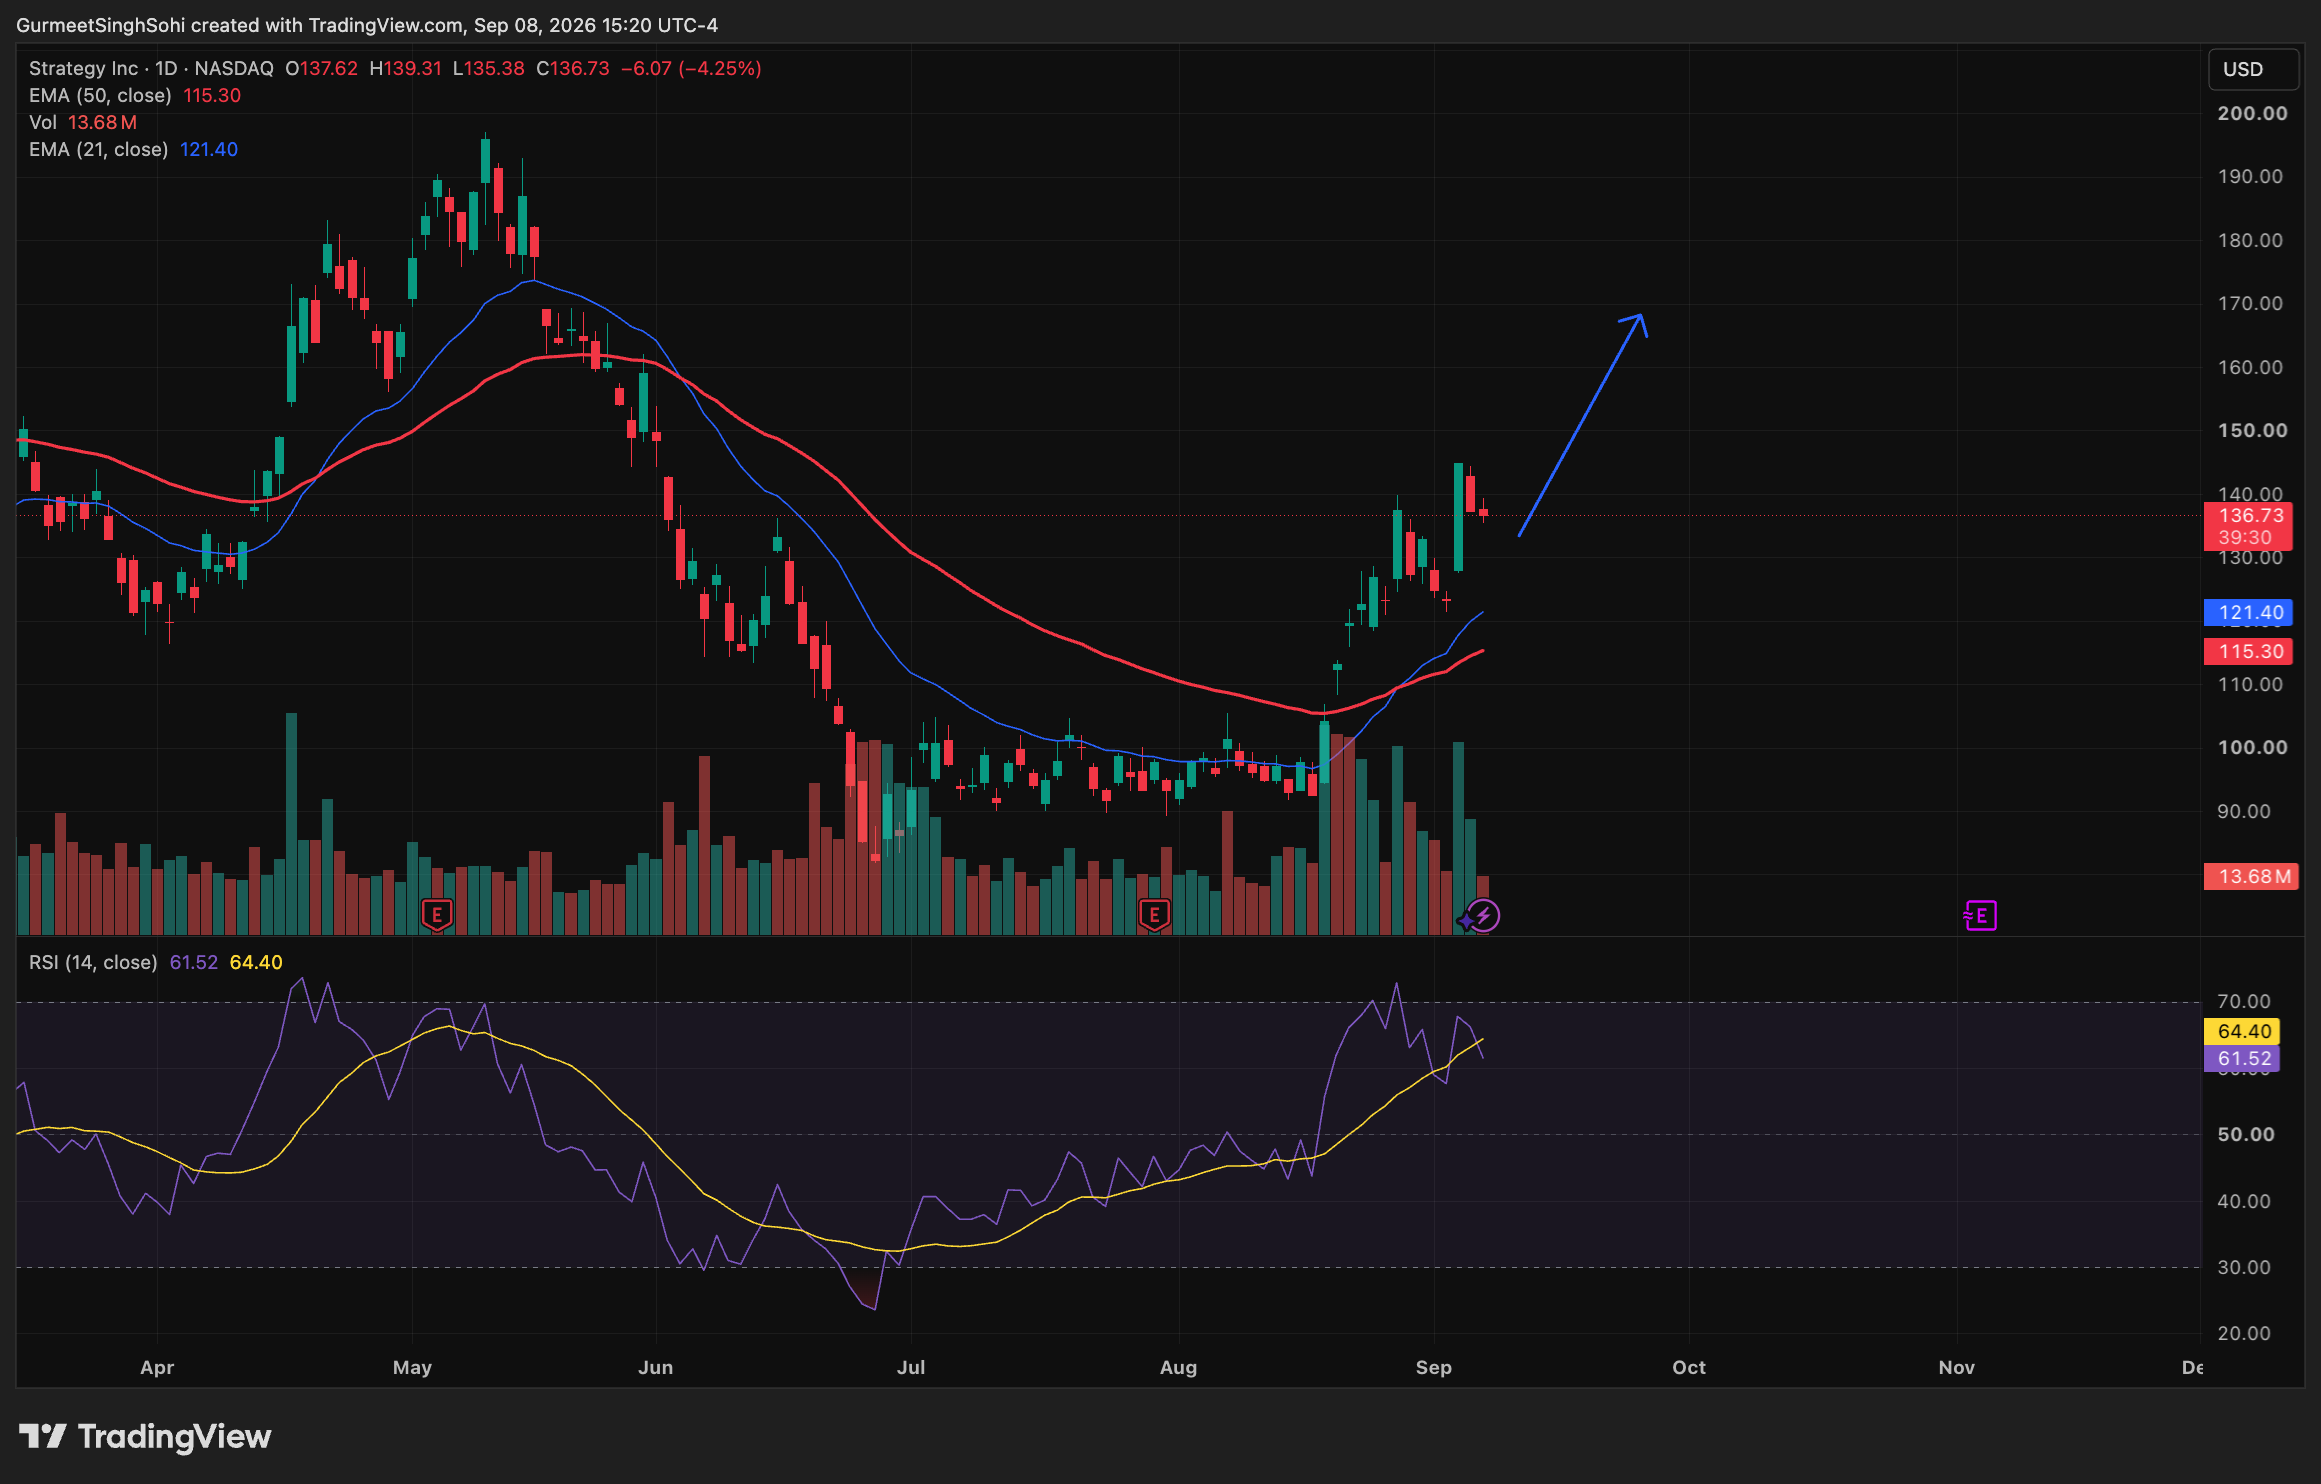
SWING TRADE - NEW POSITION IN MSTR
SWING TRADE - NEW POSITION
Stock : MSTR
Side : Long
Entry : 136.65
Qty : 250
Follow the trades on sheet: https://shorturl.at/kxhUW
Note: All content, trading ideas, signals, setups, open positions, and closed positions in this sheet are for educational and informational purposes only. They should not be construed as financial advice or recommendations to buy or sell any security or specific assets.
J
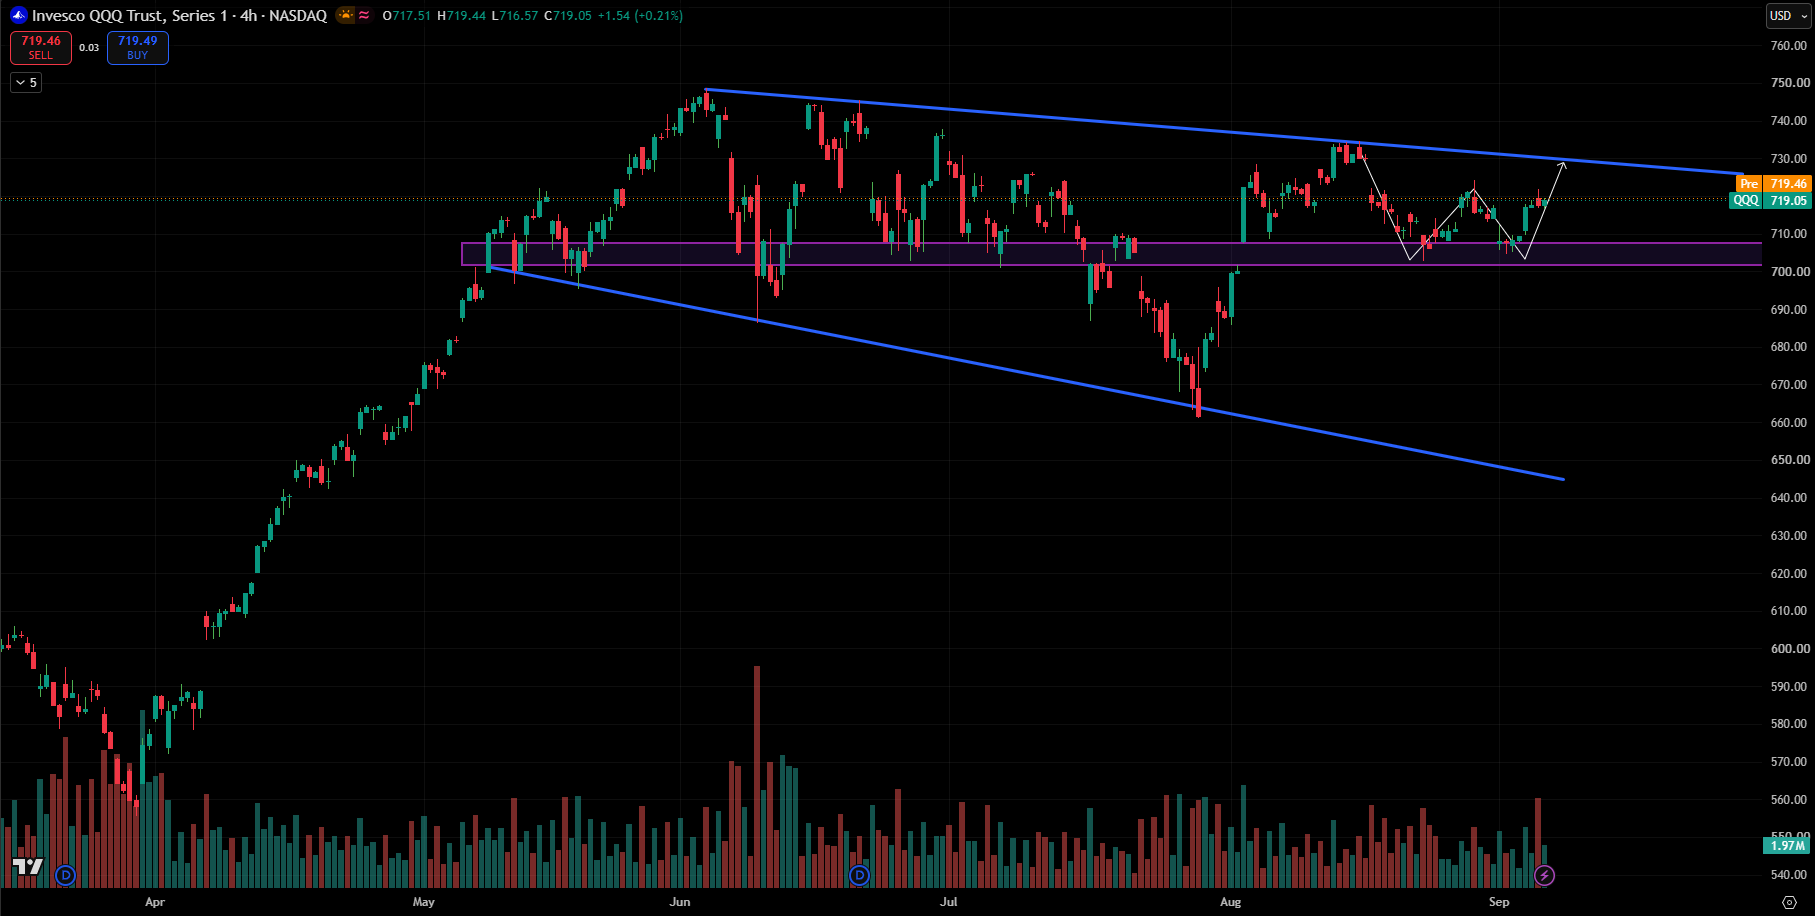
QQQ Consolidates Near 720 Ahead of Key Resistance, Holds Support as Bulls Eye 730 Breakout.
- QQQ is trading around 719, showing a recovery from the 702–707 demand zone and forming a short-term higher-low structure.
- 710–712 is the immediate support; holding above this level keeps buyers in control and favors another attempt higher.
- 724–726 is the first resistance, where some profit-taking/rejection can occur.
- The major hurdle is 730–732, aligning with the descending trendline and previous rejection area.
- A 4H close above 730–732 with strong volume would confirm a trendline breakout, targeting 740–745 and potentially 748–750.
- If price gets rejected around 730 and loses 710, the next major test is 702–707 support.
- Below 702, the bullish structure weakens significantly, with downside levels around 695–698 and then 680–685.
- Overall bias: Mildly bullish while above 707; breakout above 732 turns strongly bullish.
J
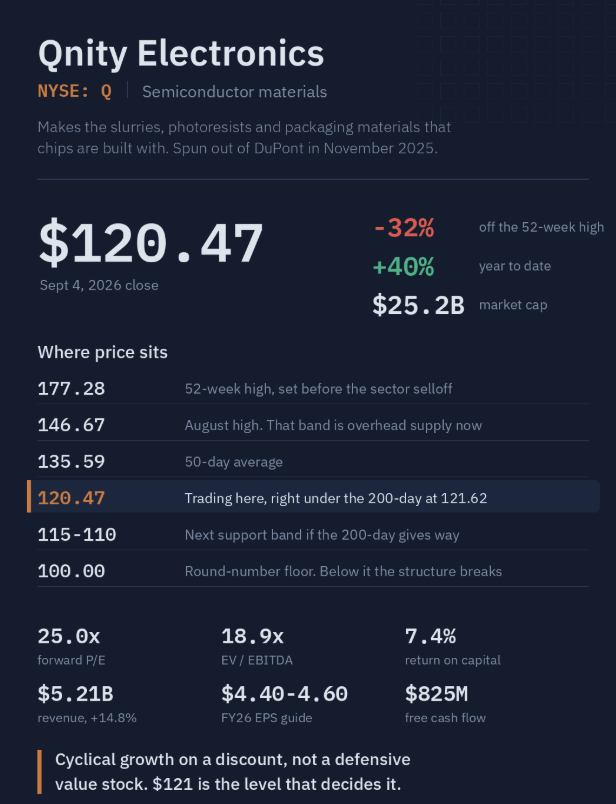
Qnity Electronics (NYSE: Q) - DuPont's Chip-Materials Spinoff, 32% Off Its High!
Overview
- Spun out of DuPont on Nov 1, 2025 and went straight into the S&P 500, trading on NYSE under "Q"
- Pure-play advanced electronics materials supplier across the semiconductor value chain; ~10,000 employees, HQ Wilmington, Delaware
- Led by CEO Jon Kemp, who ran DuPont's Electronics & Industrial business before the split
- Market cap $25.2B; 52-week range $70.50–$177.28 — down ~32% from the high, still up ~40% YTD
Business model
- Sells consumables used at nearly every step of chip making — revenue scales with wafers processed, not one customer's capex
- Semiconductor Technologies: CMP pads and slurries, photoresists, cleaners — $744M net sales in Q2 FY26
- Interconnect Solutions: thermal and signal management for PCBs and advanced packaging — $685M in Q2
- Roughly two-thirds of the portfolio tied directly to semis, leveraged to AI, HPC and the 2D→3D stacking shift
Fundamentals
- TTM revenue $5.21B (+14.8%), net income $586M, EPS $2.79
- Q2 FY26: revenue $1.4B, adj EPS $1.19 vs $1.06 consensus — ninth straight quarter of profitable growth
- FY26 guidance raised to revenue $5.55–5.65B and adj EPS $4.40–4.60 (from $3.80–4.14)
- Margins: gross 46.2%, EBITDA 29.3%, net 11.3%; FCF $825M
- Carries spin-off leverage: $4.53B debt vs $961M cash, D/E 0.60, Debt/EBITDA 2.88
- ROE 6.7% and ROIC 7.4% — thin returns for the multiple; Piotroski F-Score 4
Valuation metrics
- Trailing PE 43.2, forward PE 25.0, PEG 1.32
- EV/EBITDA 18.9, P/S 4.8, P/B 3.5, P/FCF 30.6
- FCF yield 3.3%; dividend $0.32 (0.27% yield), payout ratio just 11%
- Not statistically cheap — the discount is to its own price, not to the sector
- 8 analysts, consensus Strong Buy, average target $176.75 (~47% upside)
Technical analysis
- Price $120.47 sits below the 50-DMA at $135.59 and just under the 200-DMA at $121.62 — first real test of the long-term line
- RSI 39.6 — weak, not washed out
- August traded $125.31–$146.67; that band has broken and now sits as overhead supply
- Support: $121 (200-DMA) → $110–115 → $100. Resistance: $135 → $147 → $177
- Short interest only 2% of float, institutions hold 79% — this is de-rating, not a short attack
Future growth outlook
- The 2D-to-3D architecture shift raises process steps and material intensity per wafer — more content per chip made
- Management flagged 50%+ YoY growth in advanced packaging, thermal management and AI PCBs at the Deutsche Bank conference
- Street models revenue +12.6% and EPS +22.3% CAGR over three years
- Ken Rizvi joins as CFO Oct 1; term loans were repriced lower in July
- Risks: new US tariffs on Taiwan, Korea and Japan supply chains, AI-capex sentiment, and a short standalone operating history
Snapshot
- Picks-and-shovels AI materials supplier, 32% below its high, sold off with the sector rather than on company news
- Cheap only on forward numbers (25x FY26 EPS) — trailing metrics are rich, returns on capital are low
- $121 is the level. Holds = accumulation zone; loses = wait for $110–100
- Position sizing matters — this is a cyclical growth name on discount, not a defensive value stock
Not investment advice.
J
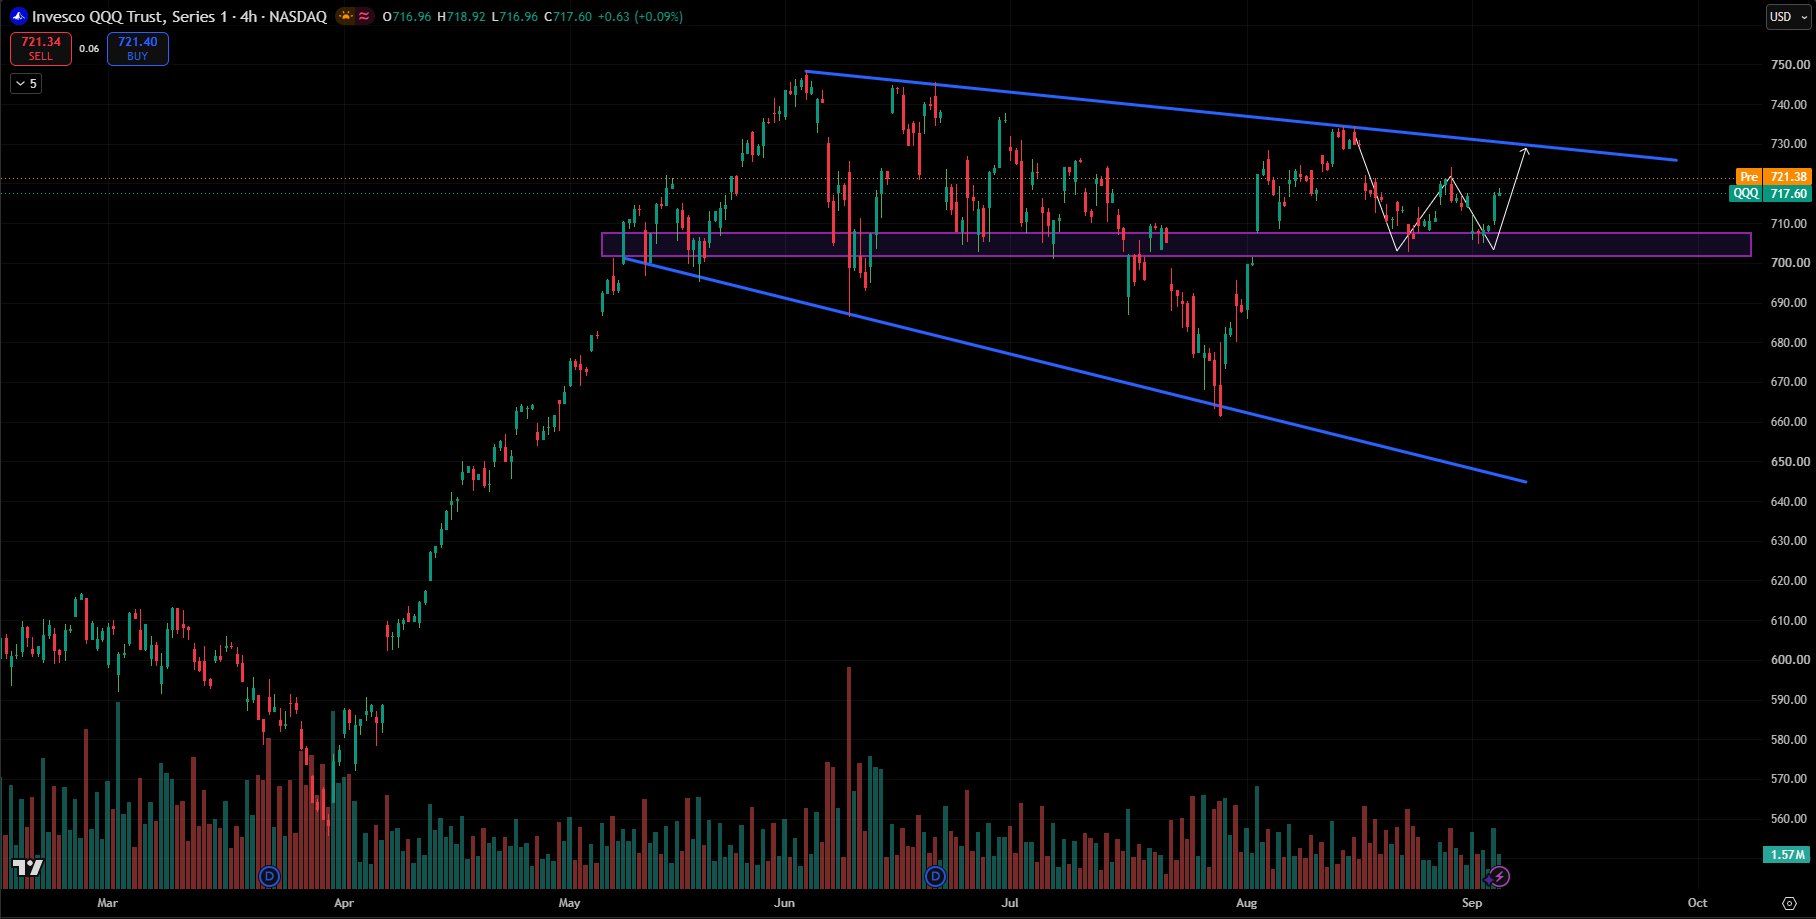
QQQ Consolidates Near Key Support - Breakout Above $730 Could Trigger Fresh Highs
- Consolidation: QQQ is consolidating between the $702–707 support zone and the descending trendline resistance near $728–730.
- Support Holding: Price has repeatedly bounced from the $702–707 demand zone, making it the key level for bulls.
- Bullish Setup: The recent price action resembles a double-bottom / higher-low formation near support, suggesting potential upside.
- Breakout Trigger: A clean breakout above $722–725 would strengthen momentum and open the way toward $730+.
- Major Resistance: The descending trendline around $728–730 remains the key barrier; a break above it could signal a larger move toward $740–750.
- Bearish Scenario: A decisive break below $702 would invalidate the bullish setup and could trigger a deeper correction toward $690–680.
Overall: Bias is cautiously bullish above $702–707, with $730 as the immediate upside target. The setup is essentially support → breakout → descending trendline test.
G
ORCL - Trade Close Update
https://seekingidea.com/community/post/swing-trade-new-position-in-oracle-orcl-aug-25-2026
ORCL - Trade Close with Profit
J
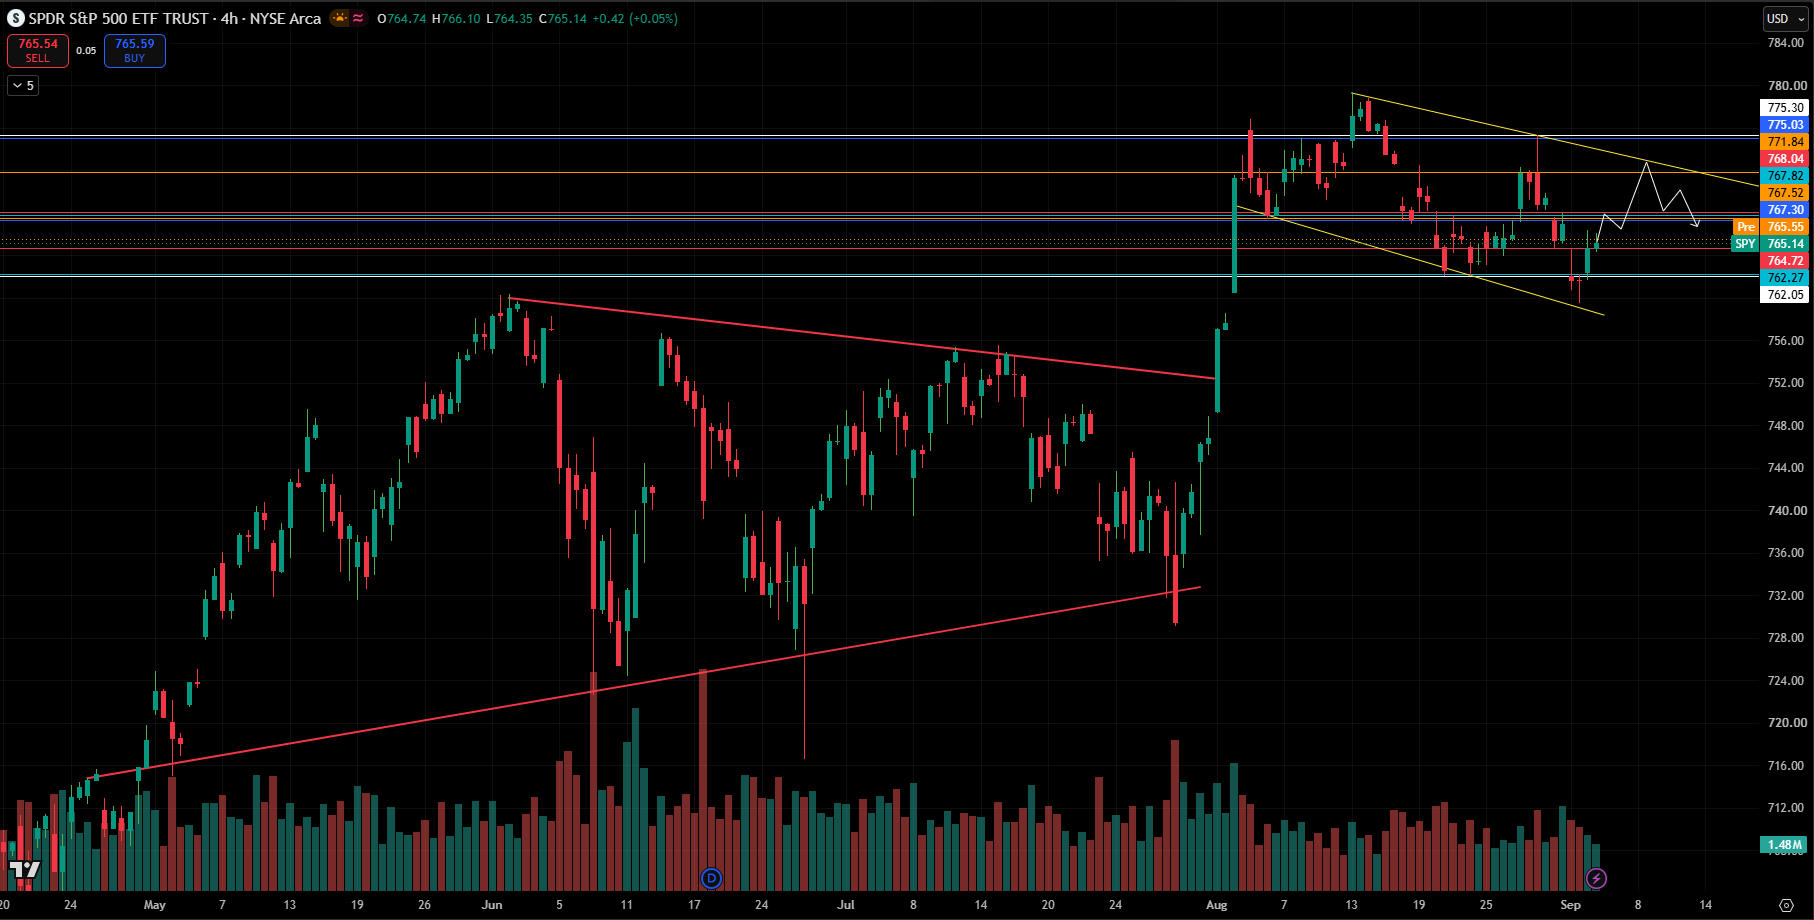
SPY Builds a Tight Consolidation, Below Resistance - Big Move Ahead.
- Structure: SPY remains inside a descending channel/consolidation after the rejection near 779–780. Price is now around 765, sitting near the middle/lower portion of the range.
- Immediate support: 764.7–765.0 is the first key zone. Holding this keeps the short-term bullish recovery structure intact.
- Major support: 762.2–762.5. A 4H close below this would weaken the setup and could open 760 → 758.
- Resistance: 767.5–768.5 is the first major hurdle and also overlaps with the descending trendline. A clean breakout with volume would be significant.
- Upside targets: Above 768.5, watch 771.8, then 775.0–775.5. A breakout above 775 could bring 779–780 back into play.
- Bias: Neutral-to-bullish above 764–762, but SPY needs to reclaim 768+ to confirm momentum. Until then, expect choppy price action within the yellow channel.
G
SWING TRADE - NEW POSITION : BA
Stock : BA
Side : Long
Entry : 209
Qty : 150
Follow the trades on sheet: https://shorturl.at/kxhUW
Note: All content, trading ideas, signals, setups, open positions, and closed positions in this sheet are for educational and informational purposes only. They should not be construed as financial advice or recommendations to buy or sell any security or specific assets.

J
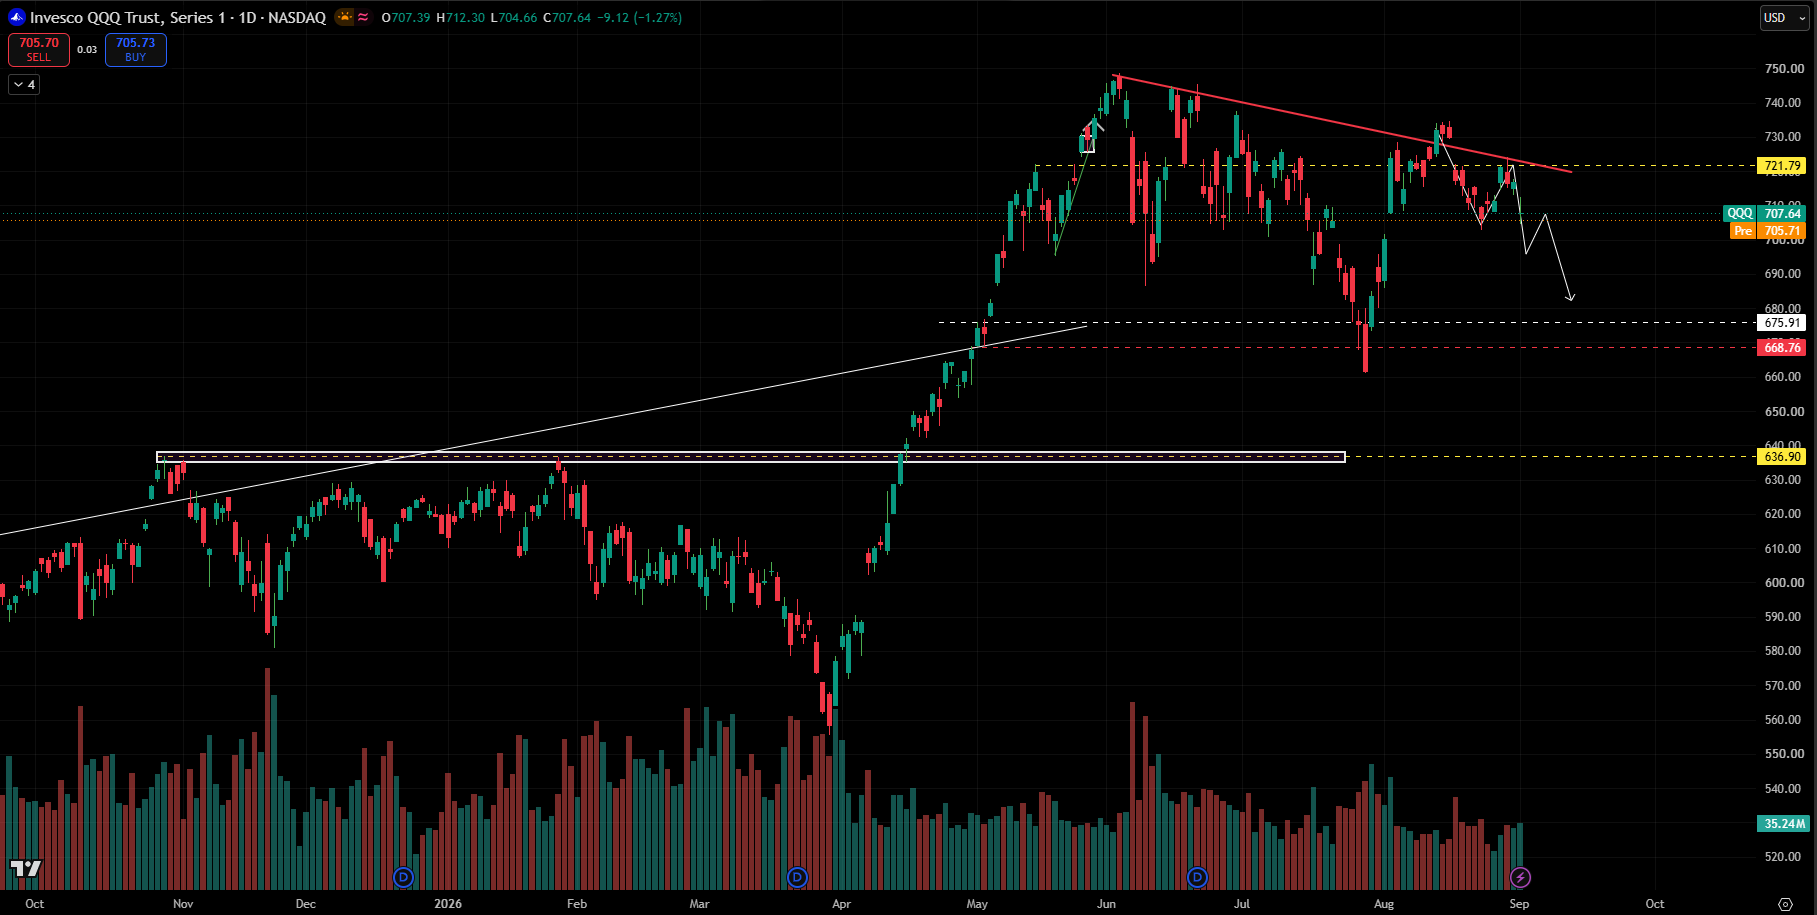
QQQ Under Pressure as Bearish Trendline Holds, Points Toward 675 Support
- Bearish structure remains intact: QQQ is trading below the descending trendline from the June high, indicating continued selling pressure and lower-high formation.
- Key resistance: 721.79 is the immediate resistance. A sustained breakout above this level, along with the falling trendline, would weaken the bearish setup and open the door toward 735–750.
- Current zone: Price is around 707, sitting near short-term support. A failure to reclaim 715–722 could trigger another leg lower.
- Downside levels: The first important support is around 700, followed by 675.91 and 668.76. A break below 668.76 would significantly weaken the broader structure.
- Major support: 636.90 remains the key historical breakout/support zone and could become relevant if the current correction accelerates.
- Overall view: Bearish below 721.79. If QQQ gets rejected from the resistance/trendline area, we can expect a move toward 690–676, with 668.76 as the next major downside target. A clean breakout above 721.79 would invalidate this bearish short-term projection.
J
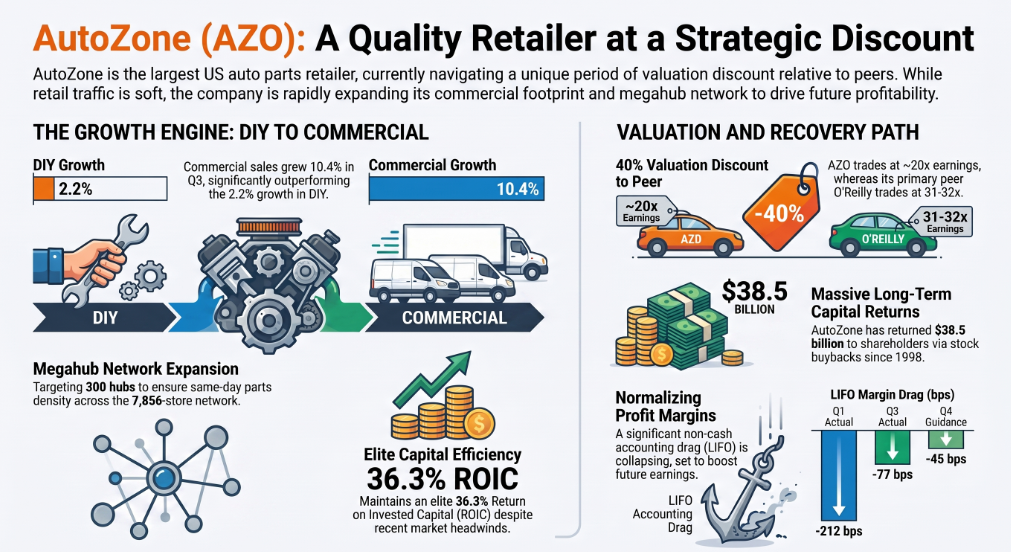
AZO - A 25-Year Compounder Just Went On Sale. Is It Actually Cheap?
Overview
- AutoZone (NYSE: AZO) — largest US auto parts retailer, 7,856 stores across US, Mexico and Brazil
- Trading ~$2,977, roughly 32% below its Sept 2025 high of $4,354 and sitting near 52-week lows
- Market cap ~$48.6B at 20.4x trailing earnings
- Peer O'Reilly held its multiple through the same period — the market discounted AZO specifically
Business model
- Sells replacement parts and accessories only — no repair or installation revenue
- Two engines: DIY retail (~66% of sales) and commercial DIFM (~29% and growing double digits)
- Megahub hub-and-spoke network — 150+ built, targeting ~300 — delivers same-day parts density
- Commercial program now live in 94% of domestic stores
- No dividend; all excess cash goes to buybacks — $38.5B returned since 1998
Fundamentals
- Q3 FY26 sales $4.84B, up 8.4% — the best growth in over three years
- Domestic comps +4.1%, but commercial +10.4% versus DIY at only +2.2%
- EPS $38.07; nine-month EPS essentially flat at $96.74 vs $96.17
- The culprit is non-cash LIFO — a ~$207M FY26 drag, roughly $9/share after tax
- Ex-LIFO, Q3 gross margin actually expanded 20bps and adjusted EPS grew 12.5%
- ROIC 36.3% — still elite, but down from 47.7% a year ago
- DIY traffic is -3.6%; ticket inflation is carrying the comp
Valuation metrics
- 19.8x FY26E EPS of ~$150 and 16.9x FY27E of ~$176
- ORLY trades near 31-32x — AZO now sits at a ~40% discount to a peer it historically tracked closely
- Adjusted debt/EBITDAR at 2.5x, right at management's target; book equity negative by design
- Consensus target ~$3,956, with recent cuts from TD Cowen ($3,500) and Barclays ($3,637)
- FCF yield is only ~3.5% — ~$1.6B of capex eats the gap between earnings and cash
Technical analysis
- 52-week range $2,902 to $4,388 — price is in the bottom 3% of that range
- Deepest drawdown since 2020, with the ATH close at $4,354 on 11 Sep 2025
- $2,900-2,950 is the line in the sand; losing it opens air below
- First resistance near $3,300, then the $3,600-3,650 shelf where analyst targets cluster
- Trend is still down — this needs a base, not a catch
Future growth outlook
- LIFO drag is collapsing: -212bps in Q1, -138bps in Q2, -77bps in Q3, -45bps guided for Q4
- That reversal alone is why consensus has FY27 EPS jumping ~17%
- Commercial and megahub build-out remains the real engine in a highly fragmented market
- Aging US fleet plus expensive new and used cars keeps replacement demand structural
- The catch: buybacks fell from ~$3.7B a year in FY23 to ~$1.8B — share count now shrinks 2.1% vs 5-7% historically
- That removes 4-5 points from the EPS algorithm, so much of this de-rating is arithmetic, not panic
Snapshot
- Quality: elite — 36% ROIC, dominant scale, minimal digital disruption risk
- Value: cheap versus its own history and versus ORLY, but not deep value at a 3.5% FCF yield
- Bull case: capex peaks, FCF and buyback recover, multiple re-rates toward $4,000
- Bear case: DIY traffic stays negative once inflation fades, and $2,750 is fair
- Verdict: accumulate on weakness, not a table-pounder
- The number that decides it is the FY27 capex guide on Sept 22 — not Q4 EPS
Not investment advice. Do your own research.
G
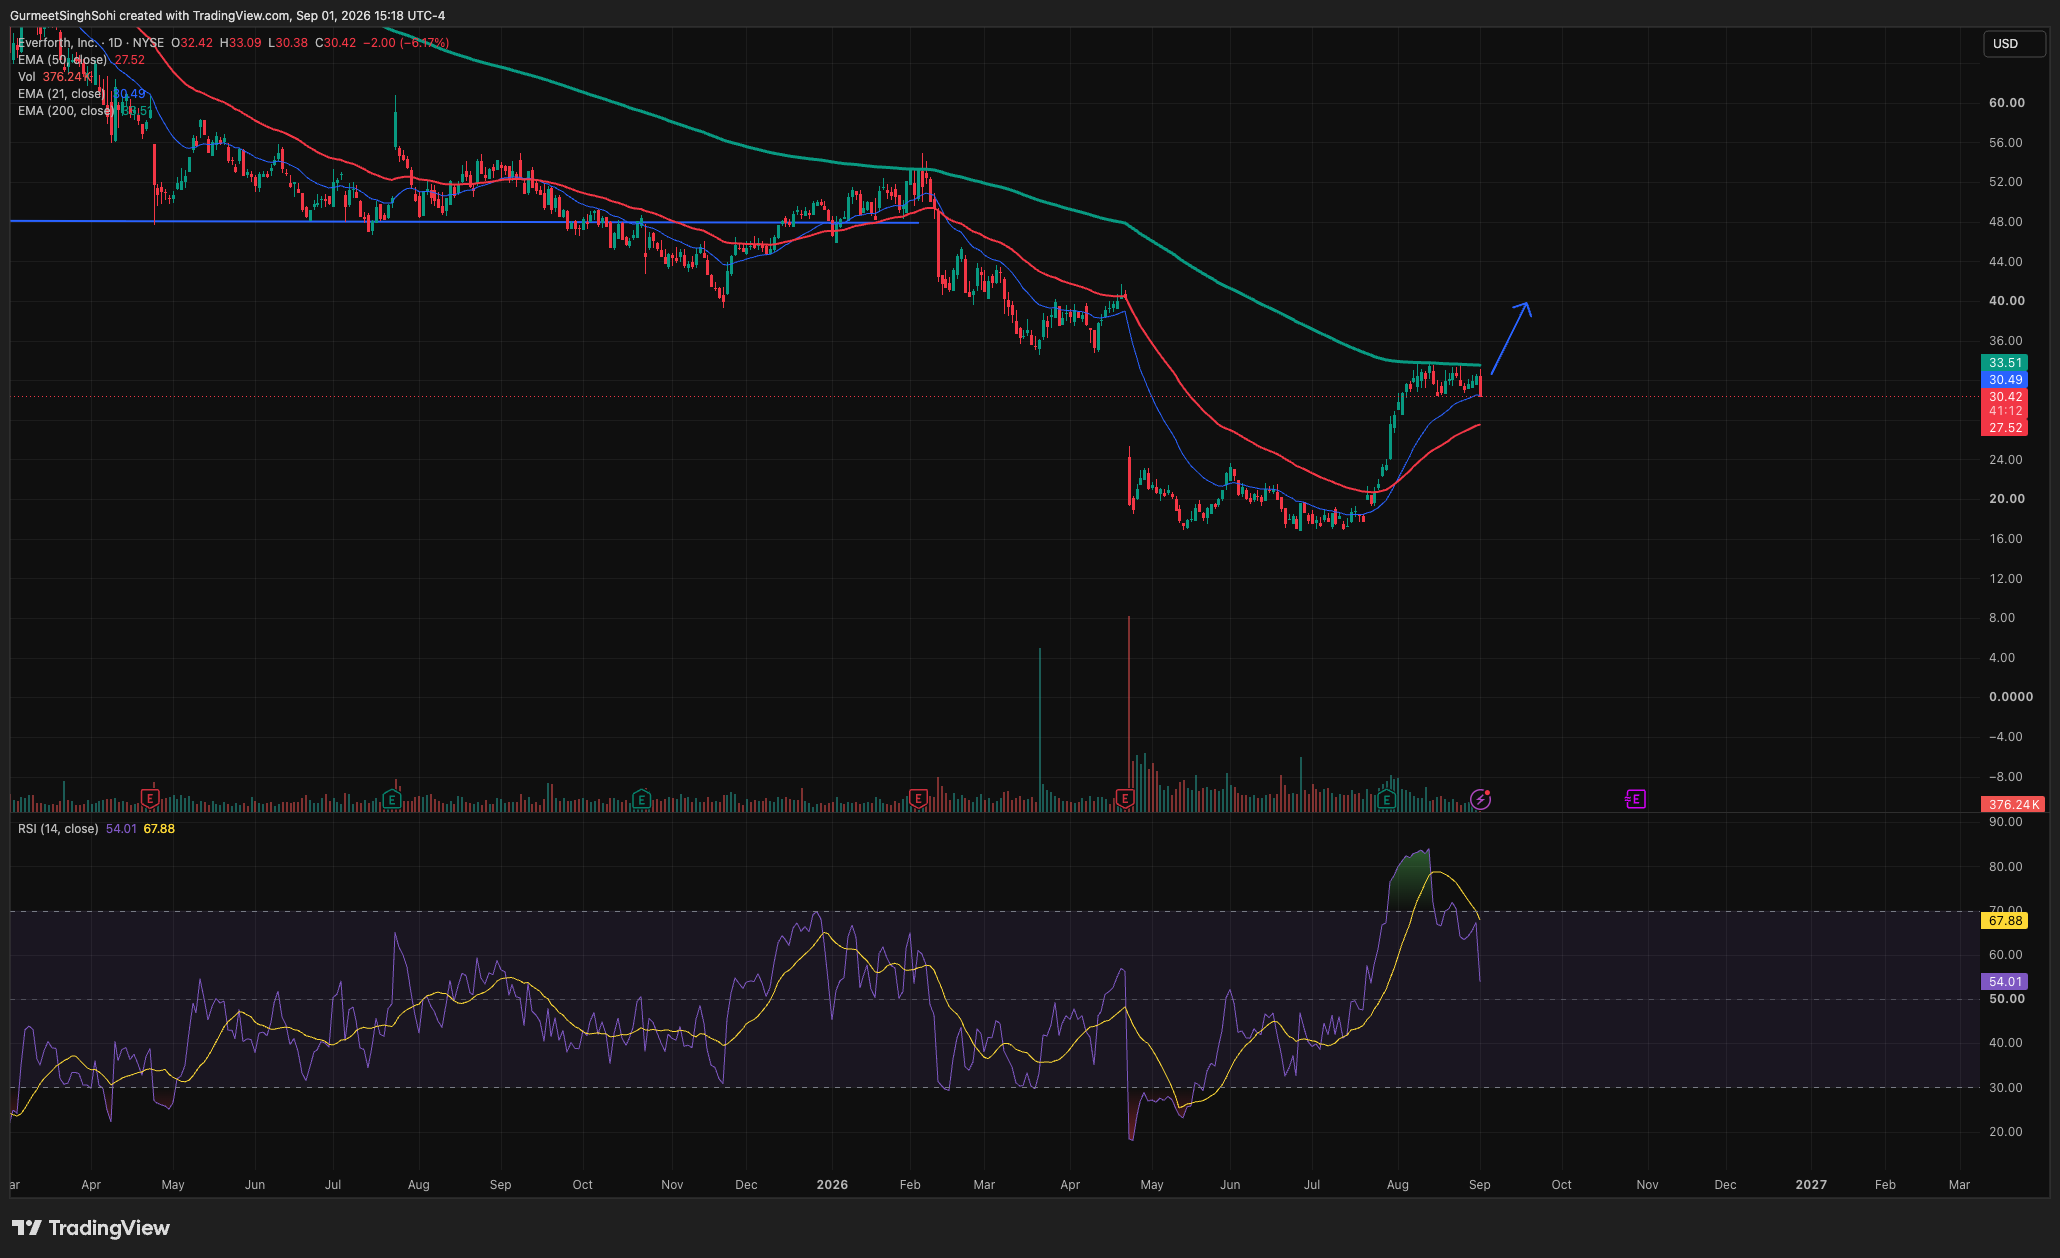
SWING TRADE - NEW POSITION IN EFOR
SWING TRADE - NEW POSITION
Stock : EFOR
Side : Long
Entry : 30.45
Qty : 1000
Follow the trades on sheet: https://shorturl.at/kxhUW
Note: All content, trading ideas, signals, setups, open positions, and closed positions in this sheet are for educational and informational purposes only. They should not be construed as financial advice or recommendations to buy or sell any security or specific assets.
G
Trdae Close : ABNB
https://seekingidea.com/community/post/swing-short-trade-new-position-abnb-aug-26-2026
ABNB - Trade closed @ $183.48 in Profit.
G
MLM: Adding 50 more shares into MLM position.
https://seekingidea.com/community/post/mlm-new-long-position-53980-swing-trade-aug-24-2026
ADDING 50 more shares into the MLM position @ $507.80, which brings the average price to $523.80 with a total of 100 shares.
J
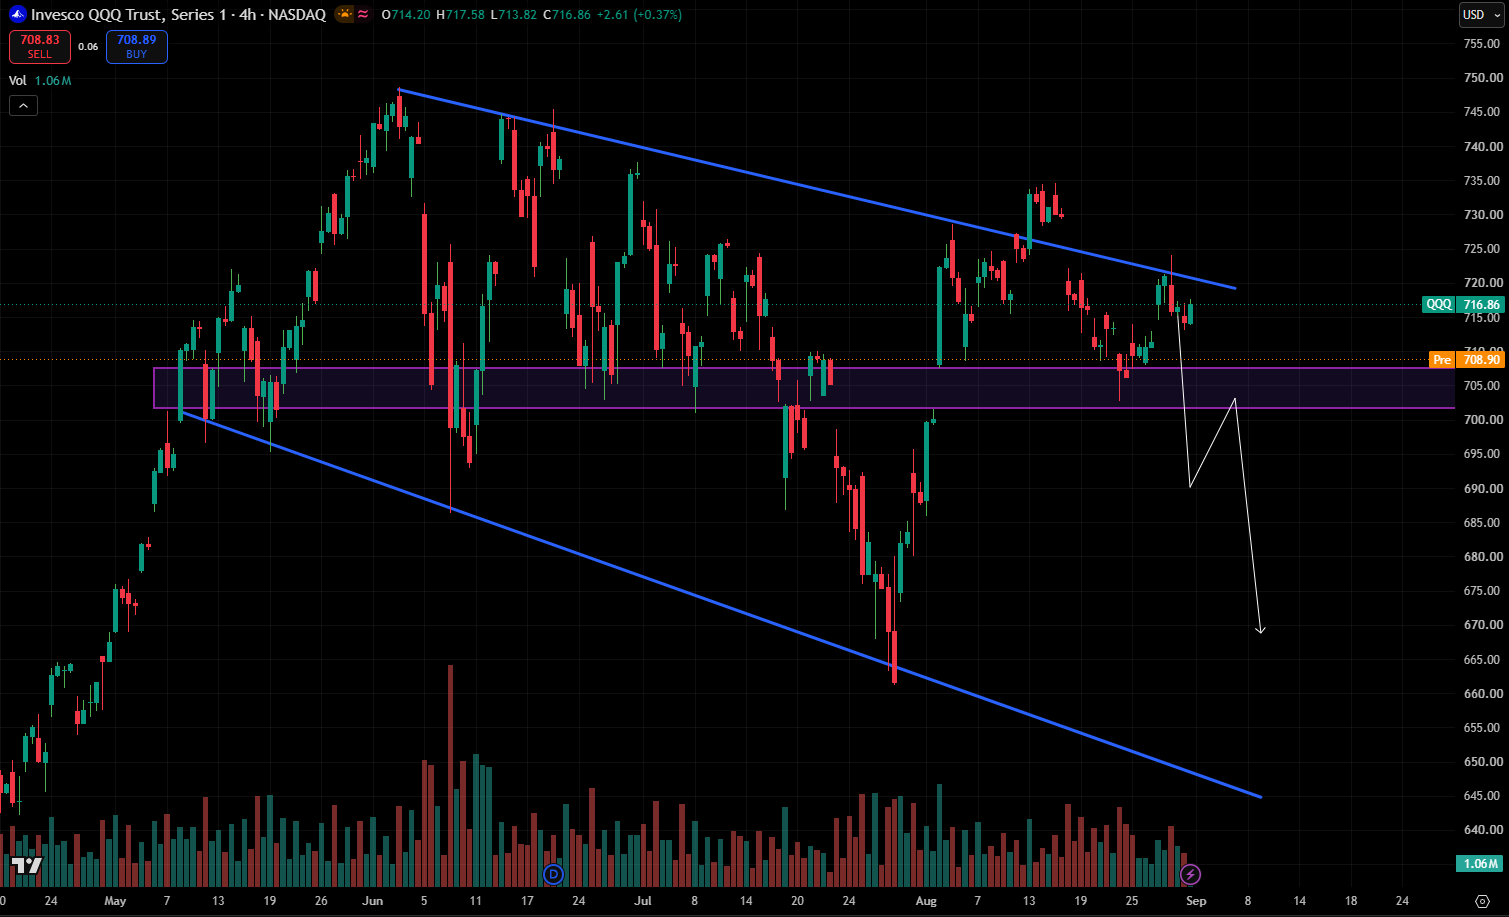
NASDAQ (QQQ) Faces Trendline Rejection Risk - $702 Support Holds the Key
- Key levels:
- Resistance: $720–725 → $735–740 → $748–750
- Support: $702–708 → $690 → $670
- Bullish trigger: Break & 4H close above $725
- Bearish trigger: Break below $702
- Trend: QQQ remains within a broad descending channel, with the upper blue trendline continuing to act as resistance. Price is currently around $717.
- Immediate resistance: $720–725 is the key supply zone and trendline resistance. A clean 4H breakout above this area would improve the bullish setup.
- Key support: The purple $702–708 zone is the most important near-term support. Price needs to hold this area to avoid further downside.
- Bearish setup: The current structure still shows lower highs. A rejection from $720–725 followed by a break below $702 could trigger a move toward $690, then $670.
- Bullish scenario: If QQQ reclaims $725 with strong volume, the next targets are $735–740, followed by the $748–750 area.
- Overall: Bearish/neutral below $725. The chart favors a downside retest while price remains below the descending trendline. The $702–708 zone is the key decision area.
G
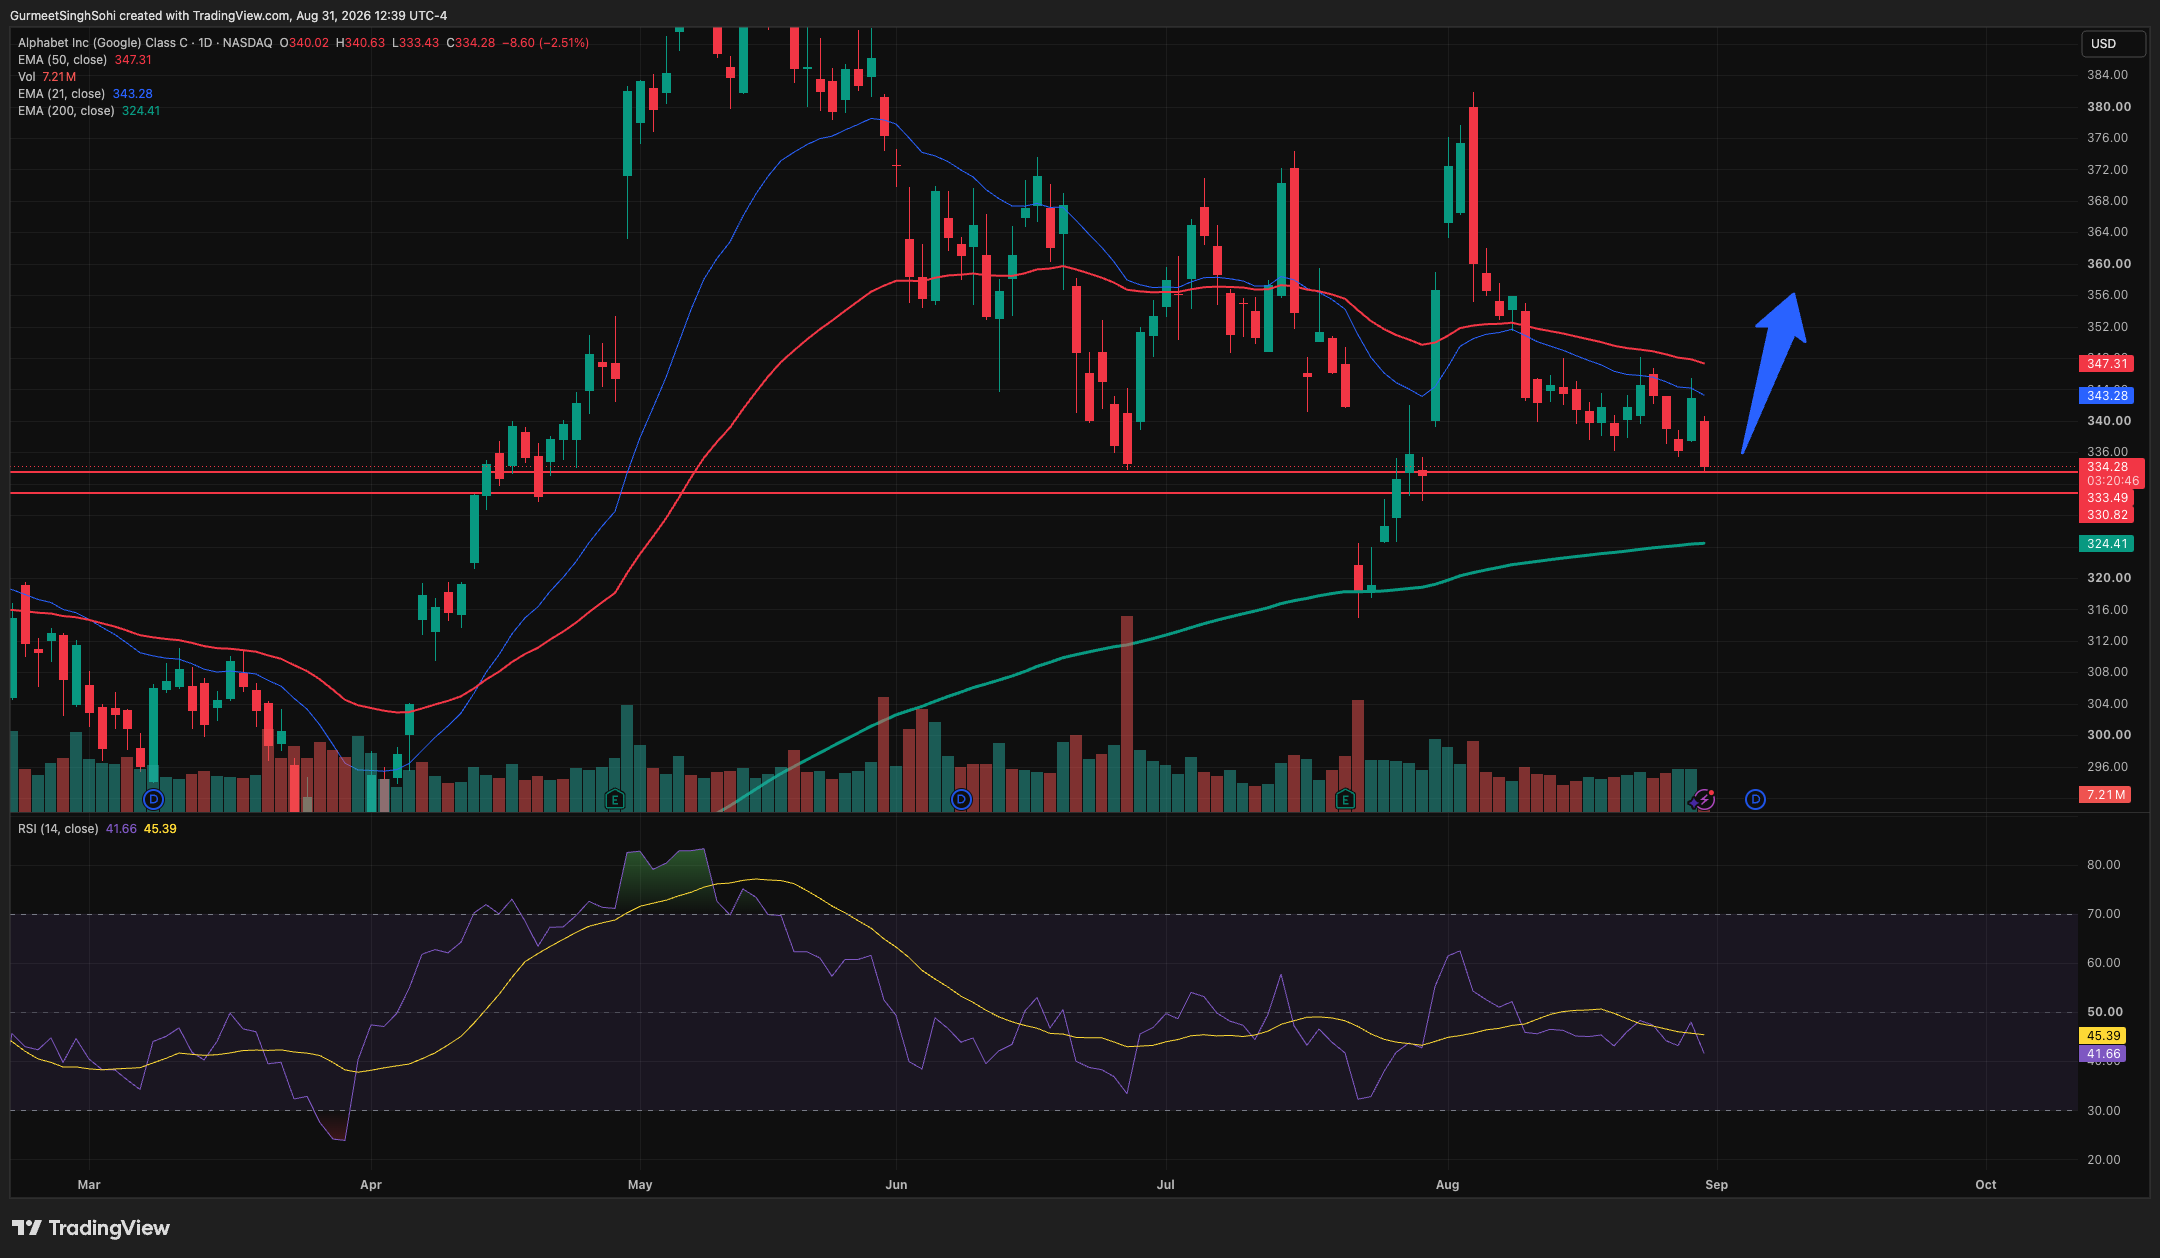
SWING TRADE - NEW POSITION IN GOOGL
SWING TRADE - NEW POSITION
Stock : GOOG
Side : Long
Entry : 334.35
Qty : 120
Follow the trades on sheet: https://shorturl.at/kxhUW
Note: All content, trading ideas, signals, setups, open positions, and closed positions in this sheet are for educational and informational purposes only. They should not be construed as financial advice or recommendations to buy or sell any security or specific assets.
G
SWING TRADE - NEW POSITION : AEE
Stock : AEE
Side : Long
Entry : 105.35
Qty : 250
Follow the trades on sheet: https://shorturl.at/kxhUW
Note: All content, trading ideas, signals, setups, open positions, and closed positions in this sheet are for educational and informational purposes only. They should not be construed as financial advice or recommendations to buy or sell any security or specific assets.

J
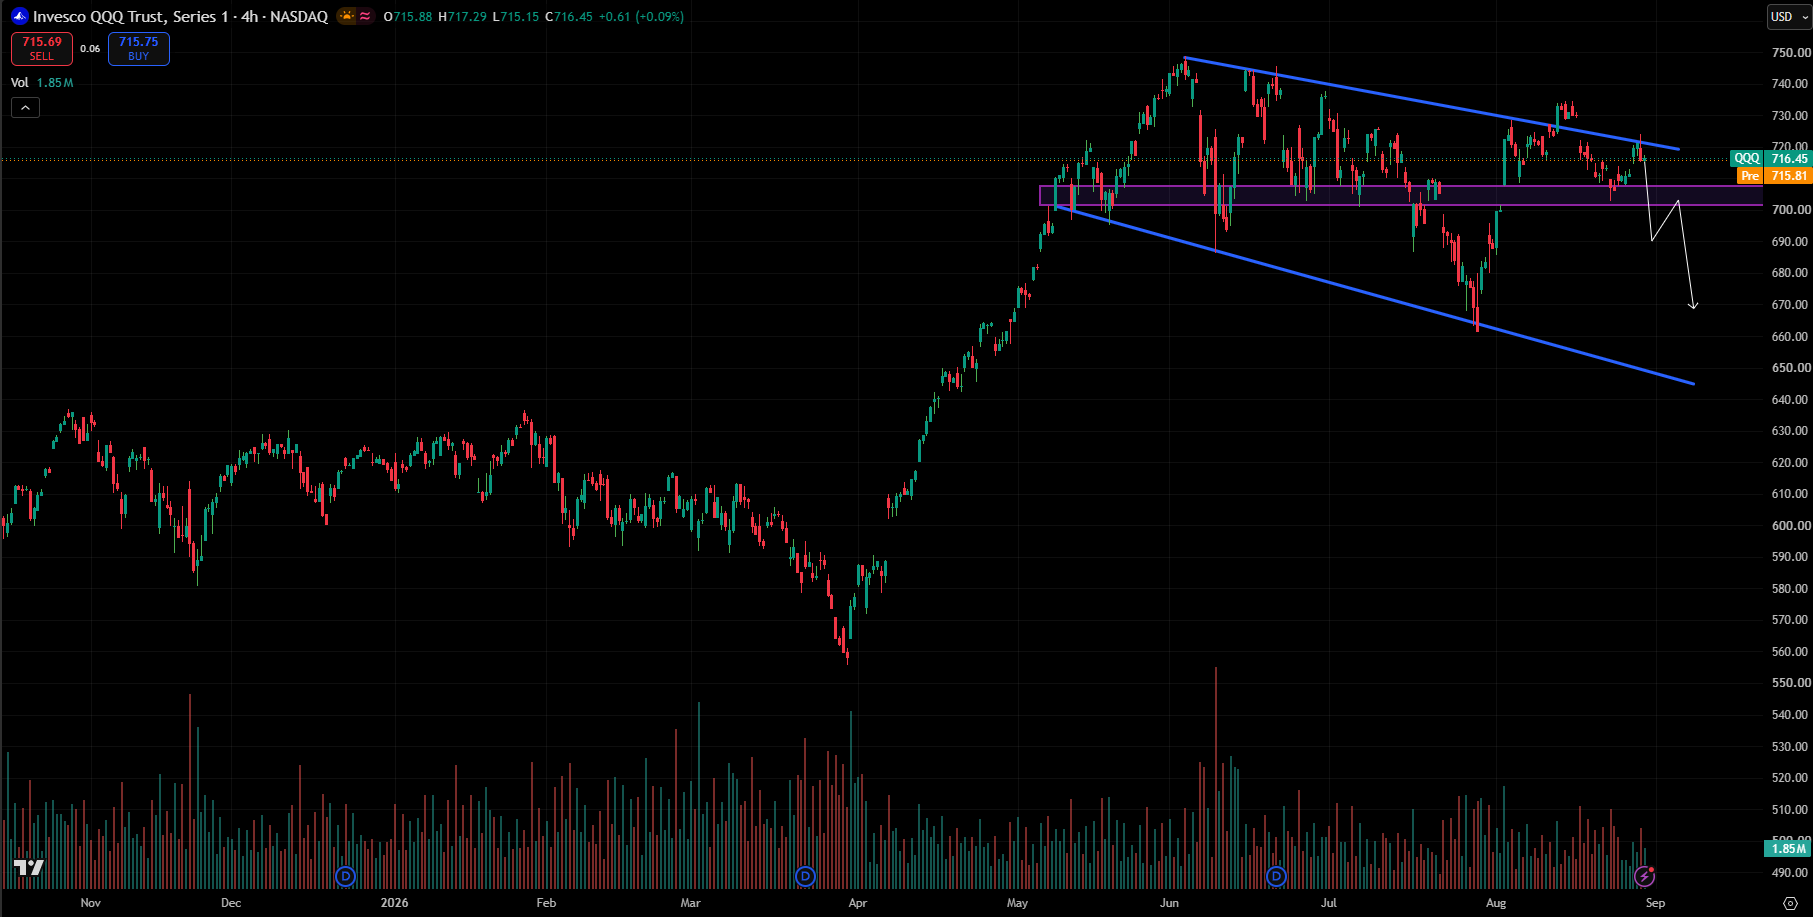
NASDAQ (QQQ) Tests Descending Resistance - $700 Support Remains the Key Level.
- Key levels:
Resistance: $720–725 → $735–740 → $750–755
Support: $700–705 → $690 → $670
Major bullish trigger: 4H close above descending trendline
Major bearish trigger: 4H close below $700
- Structure: QQQ remains inside a broad descending channel/consolidation after the June high near $750, with lower highs forming beneath the blue resistance trendline.
- Immediate resistance: Price is currently around $716, testing the descending trendline. A decisive 4H close above $720–725 would be the first meaningful bullish signal.
- Key support: The $700–705 zone is the major horizontal support. Buyers have repeatedly defended this area, making it critical for maintaining the current structure.
- Bullish scenario: A breakout above the descending trendline could trigger a move toward $735–740, followed by a possible retest of the $750–755 June highs.
- Bearish scenario: Failure at the trendline followed by a breakdown below $700 would weaken the structure and open $690 → $670 as the next downside zones.
- Overall view: Neutral-to-bearish below $720–725, but the setup can turn bullish quickly on a confirmed trendline breakout. Until then, the risk remains tilted toward a rejection and retest of $700.
A
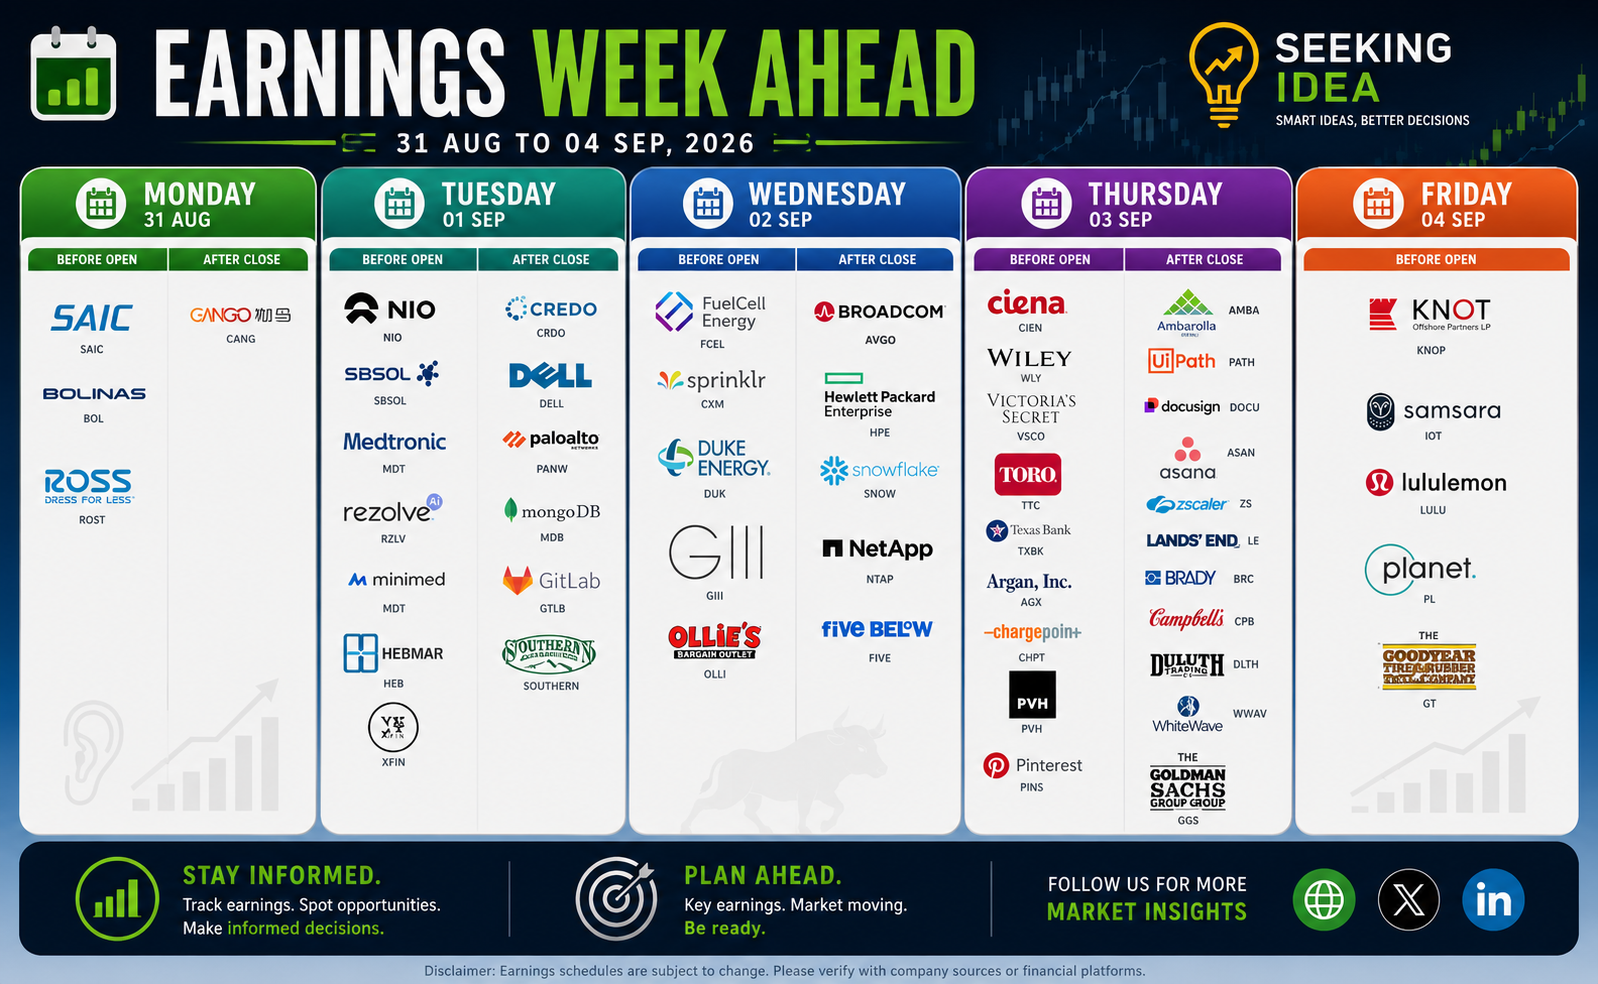
Earnings Week Ahead
Earnings Week Ahead
G
SWING TRADE - NEW POSITION IN CRCL
SWING TRADE - NEW POSITION
Stock : CRCL
Side : Long
Entry : 87.58
Qty : 400
Follow the trades on sheet: https://shorturl.at/kxhUW
Note: All content, trading ideas, signals, setups, open positions, and closed positions in this sheet are for educational and informational purposes only. They should not be construed as financial advice or recommendations to buy or sell any security or specific assets
J
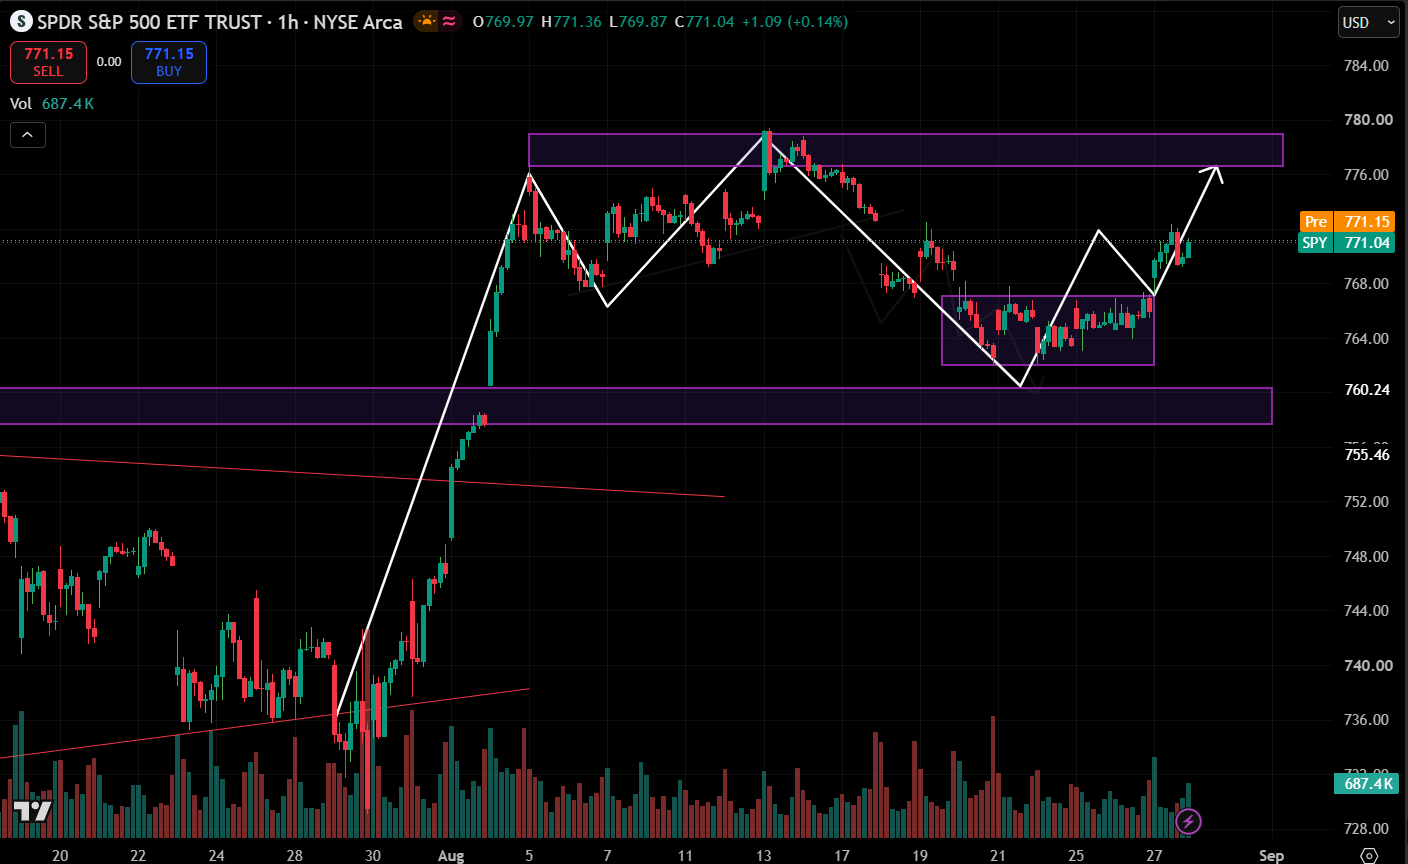
SPY Builds Bullish Base: 776–779 Breakout Could Trigger Fresh Highs.
- Bullish structure: SPY has formed a higher-low structure after holding the 763–767 consolidation zone, with price now pushing back toward the upper resistance area.
- Immediate resistance: 776–779 is the key supply zone. This area has rejected price multiple times and sits near the recent high.
- Bullish breakout setup: A decisive 1H close above 779 would confirm a breakout from the range and could open the way toward 782–784 / new highs.
- Key support: 767–763 is the immediate demand zone. Holding this area keeps the bullish setup intact; a pullback/retest here could provide another upside opportunity.
- Major downside level: 760–758 is the broader support zone. Losing 763 and then 760 would weaken the current bullish structure and increase the probability of a deeper correction.
- Overall view: Bullish above 763, with the current structure favoring a move toward 776–779, followed by a potential breakout toward 782–784 if buyers successfully clear the resistance zone.
G
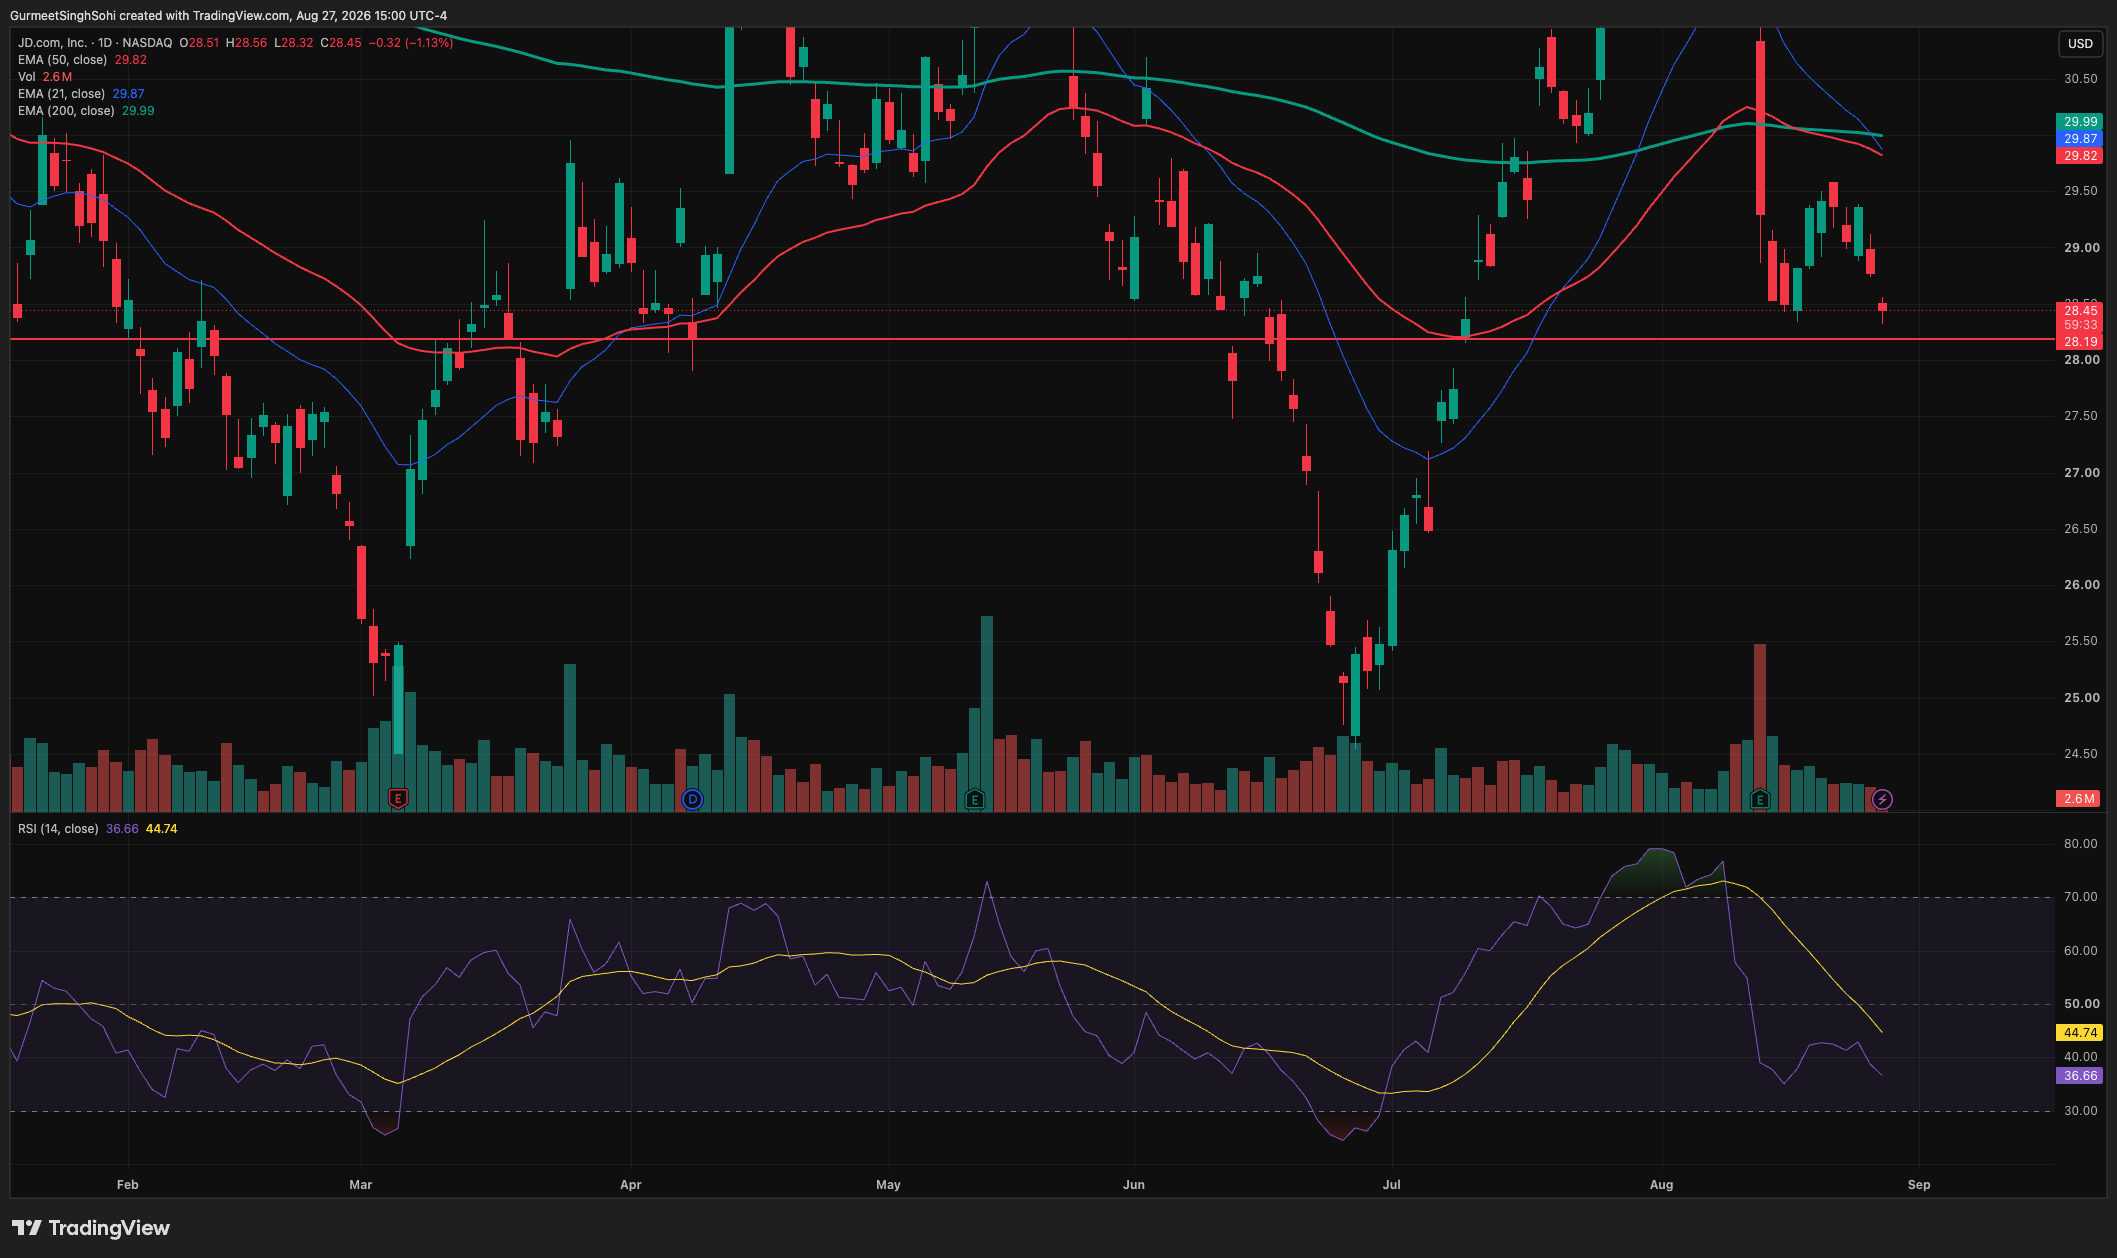
SWING TRADE - NEW POSITION IN JD
SWING TRADE - NEW POSITION
Stock : JD
Side : Long
Entry : 28.45
Qty : 1200
Follow the trades on sheet: https://shorturl.at/kxhUW
Note: All content, trading ideas, signals, setups, open positions, and closed positions in this sheet are for educational and informational purposes only. They should not be construed as financial advice or recommendations to buy or sell any security or specific assets.
G
SWING TRADE - NEW POSITION IN WING
SWING TRADE - NEW POSITION
Stock : WING
Side : Long
Entry : 113.30
Qty : 400
Follow the trades on sheet: https://shorturl.at/kxhUW
Note: All content, trading ideas, signals, setups, open positions, and closed positions in this sheet are for educational and informational purposes only. They should not be construed as financial advice or recommendations to buy or sell any security or specific assets.
G
SWING SHORT TRADE - NEW POSITION : ABNB
Stock : ABNB
Side : Short
Entry : 188.50
Qty : 150
Follow the trades on sheet: https://shorturl.at/kxhUW
Note: All content, trading ideas, signals, setups, open positions, and closed positions in this sheet are for educational and informational purposes only. They should not be construed as financial advice or recommendations to buy or sell any security or specific assets.

G
SWING TRADE - NEW POSITION : AKAM
Stock : AKAM
Side : Long
Entry : 109.10
Qty : 250
Follow the trades on sheet: https://shorturl.at/kxhUW
Note: All content, trading ideas, signals, setups, open positions, and closed positions in this sheet are for educational and informational purposes only. They should not be construed as financial advice or recommendations to buy or sell any security or specific assets.

G
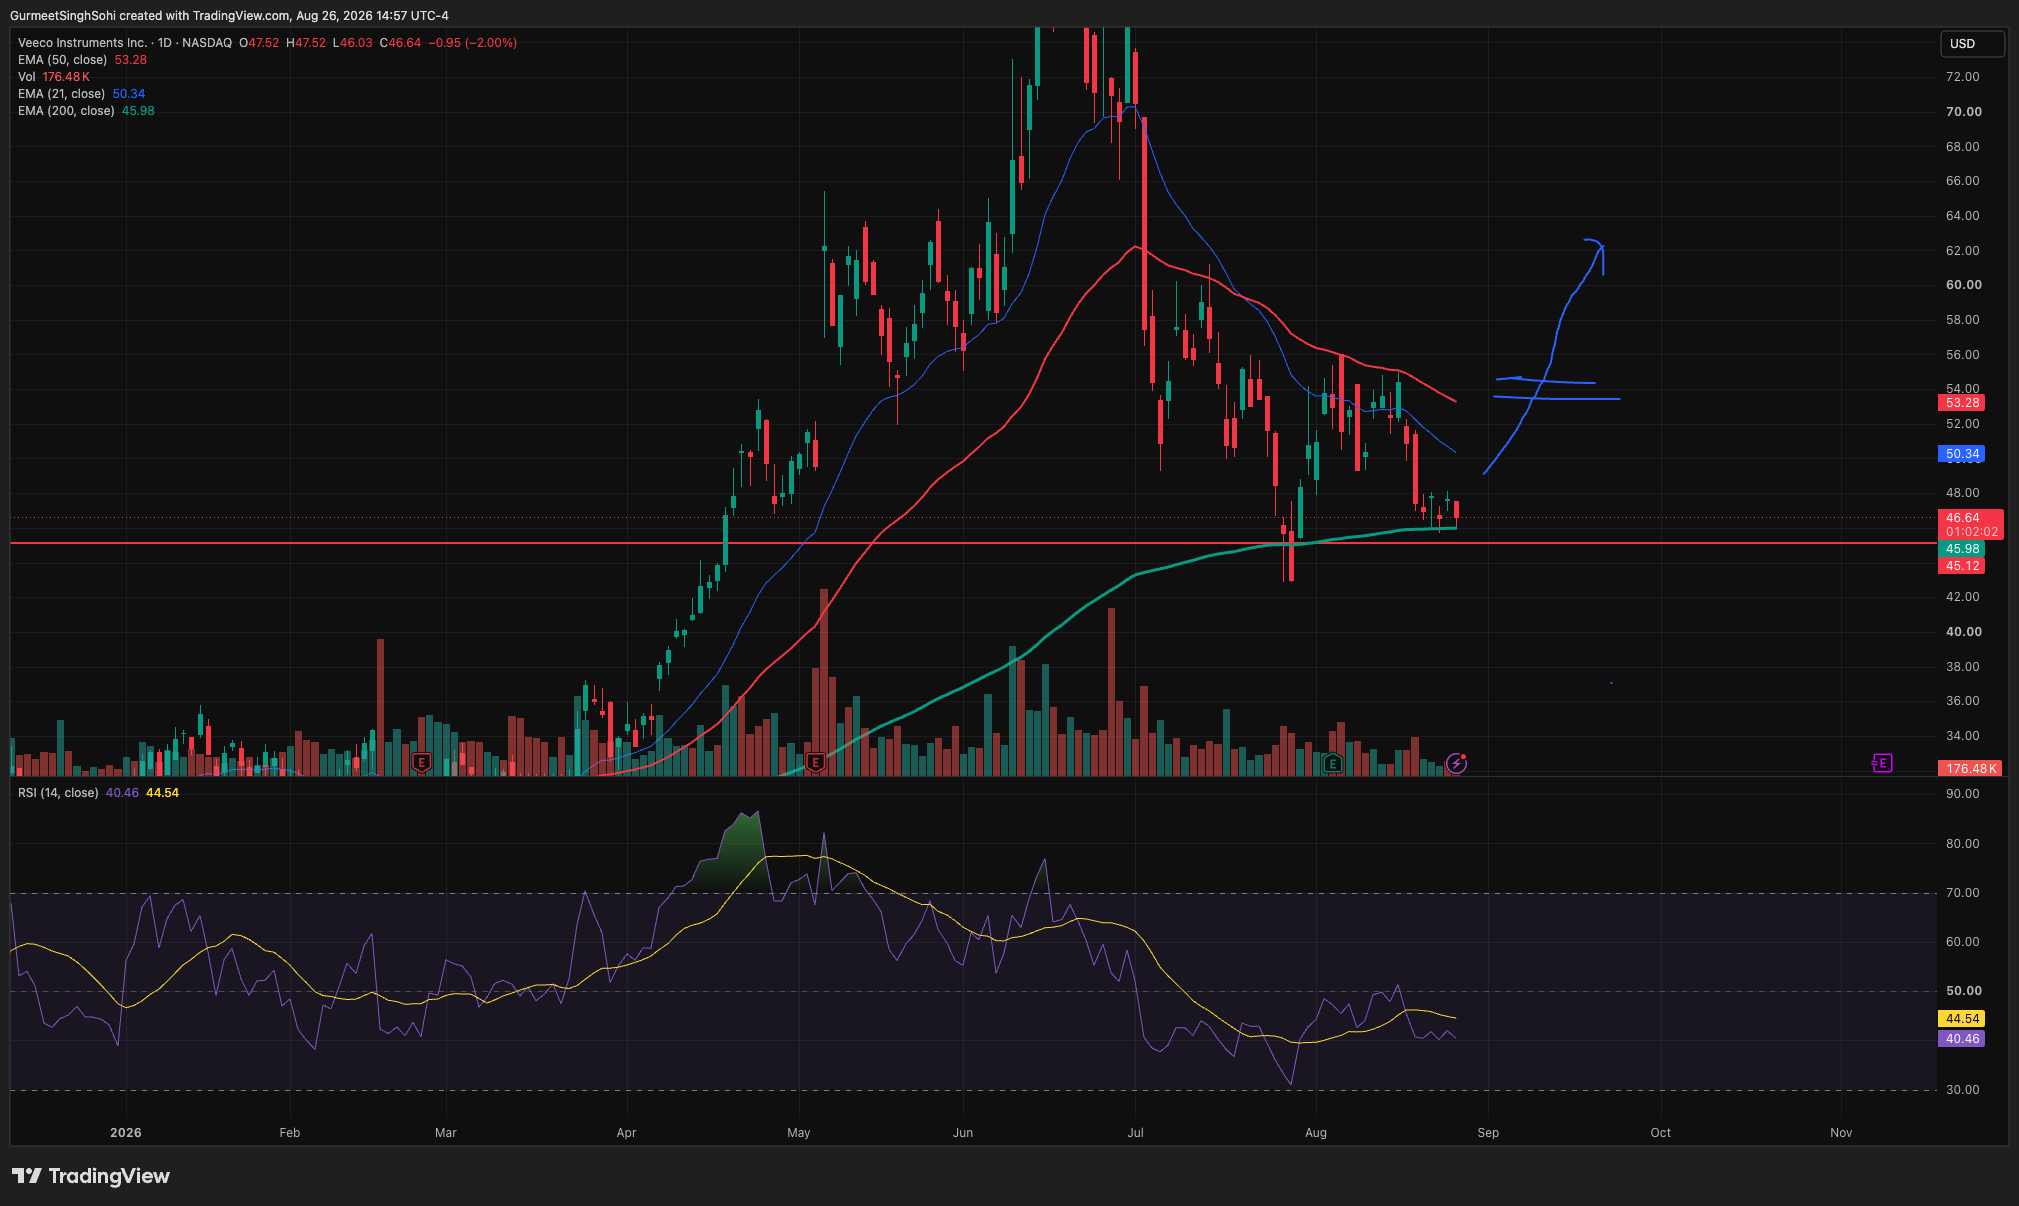
SWING TRADE - NEW POSITION IN VECO
SWING TRADE - NEW POSITION
Stock : VECO
Side : Long
Entry : 46.80
Qty : 700
Follow the trades on sheet: https://shorturl.at/kxhUW
Note: All content, trading ideas, signals, setups, open positions, and closed positions in this sheet are for educational and informational purposes only. They should not be construed as financial advice or recommendations to buy or sell any security or specific assets.
J
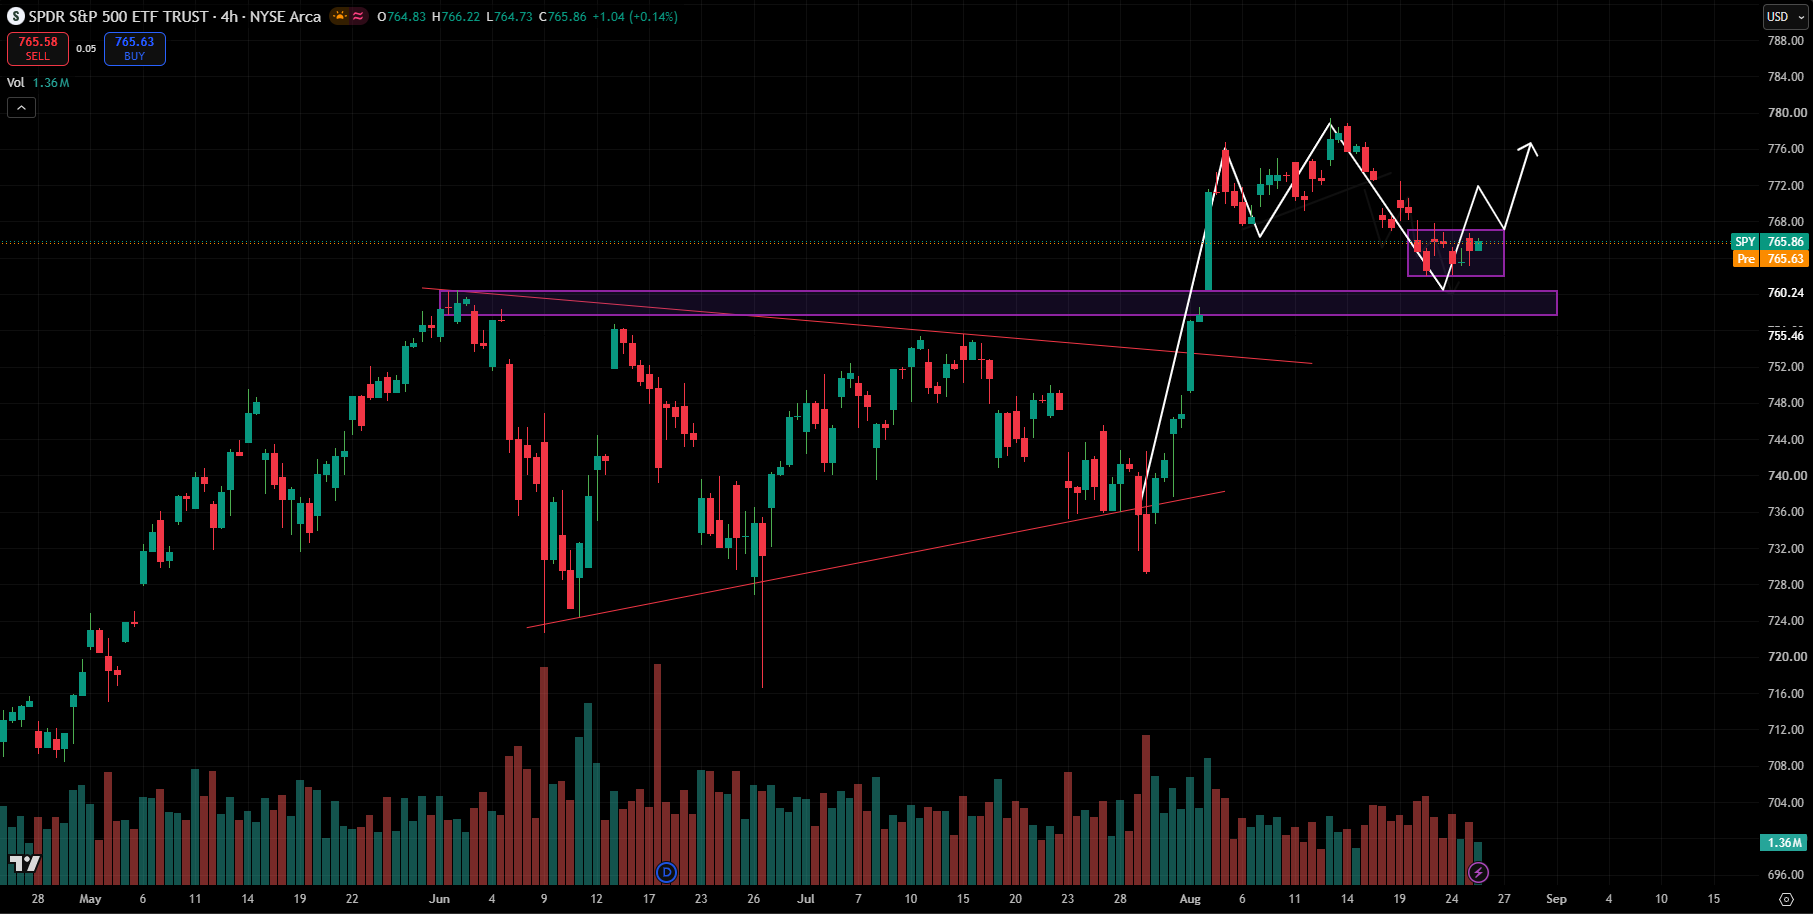
SPY Consolidates After Breakout: 780+ Could Be Next on a Bullish Breakout.
- Bullish structure remains intact after the sharp breakout above the previous 756–760 resistance zone, which has now turned into a key support area.
- Price is currently forming a tight consolidation between ~764–768, suggesting a pause rather than a clear trend reversal.
- 760–762 remains the major support zone; holding above this area keeps the broader bullish setup valid.
- A decisive breakout above 768–770, preferably with strong volume, would signal the continuation of the uptrend and open the way toward 772–776.
- 780 is the key psychological resistance/high zone; a sustained break above 780 would confirm a fresh breakout and potentially extend the move into new highs.
- Bullish view: after the breakout from this consolidation phase, we can expect a good bounce from these levels toward 780+ and potentially new highs. A breakdown below 760 would weaken this setup.
Login to add a comment